Tuesday, July 29, 2014

Liberty Global brings on G4

It's always a privilege to work with companies that are passionate about helping create a better society for us all. I have been pleased to work with a fantastic team at Liberty Global to help develop their latest publication, the company's third Corporate Responsibility Report, under the heading: Empowering a Digital Society, launched this week.  


It's a first G4 report for Liberty Global at G4 core level, with a full G4 content index online. And guess what, it's short. Weighing in at only 40 pages, Liberty Global shows how a G4 report can be focused, complete and actually very interesting. In line with the corporate mission "Connect. Discover. Be Free.", this report is about possibilities, opportunities and the transformation that technology can help create. 

As Liberty Global is the largest cable company in the world with more than 45 million subscribers, that's a lot of transformation. With a materiality matrix that places digital inclusion and protecting children online at the forefront of this international cable company's CR considerations, Liberty Global drives CR home at the core of its business. In promoting a digital society, and helping people have the confidence to get online and build the skills to do so effectively, Liberty Global's business encourages us to make the most of new digital opportunities. 

One example of many in the range of ways Liberty Global invests in promoting a digital society is through involvement with CoderDojo. CoderDojo is a volunteer-led global movement that offers free coding clubs for young people. Children between the ages of 5 and 17 learn how to make websites, applications and internet games. Dojo workshops are set up, run and taught by volunteers and offer a fun environment for discovering and developing new skills. Wish I were 17 again! I'd spend all my time at Dojos coding internet games about ice cream. Liberty Global subsidiary Telenet, in Belgium, hosted CoderDojo events to give young people an opportunity to develop the skills that will help them secure a meaningful future. In 2014, Liberty Global is supporting CoderDojo with an additional 60 Dojos across Europe, reaching an additional 2,000 young people. 

As a parent, protecting my kids online is always a concern and I have had a rather scary near-miss with my own daughter. Therefore, I can appreciate the value of the significant investment Liberty Global makes in developing tools for educators, parents and kids of different ages to help keep kids safe online and develop their online identity with consciousness of both the opportunities and the risks. Kids develop several identities online, and they are not always aware of the digital footprint they are leaving behind. The Web We Want was developed by Liberty Global, the third in a trilogy of tools to provide assistance for safe behavior online., help kids control the information they leave on the internet and decide who they want to interact with. 


In this report, Liberty Global also communicates new environmental targets to 2020. The company commits to improving the energy efficiency of its electricity consumption by 15% every year through 2020 and becoming five times more carbon efficient by 2020. Advanced technology that combines functionality in different ways has enabled Liberty Global to increase the energy efficiency of its latest set-top boxes by 40%. This means that customers using set-top boxes in the home can reduce their energy consumption, an advantage both for the bank account and for the environment. On the supply chain front, a new program was launched to assess the environmental and social performance of Liberty Global's largest 100 suppliers and this will be expanded to 200 suppliers this year. 

One of the challenges for a global company such as Liberty Global is finding the common ground that connects Liberty Global subsidiary companies on a shared page. This includes companies such as Virgin Media, Telenet, UPC and more, each reporting on CR in their own right, each with slightly different considerations in their local markets. Pulling that together in a way that leverages the strengths of the global organization and embraces the differences of each component part requires patience, skill, flexibility and inspiration. My experience with Liberty Global is that the culture is one of possibility, not one of overly prescriptive frameworks and rules, and that best practice in one part of the company is recognized and can be leveraged for the benefit of all companies. 

With this report, it's clear that ‘Empowering a digital society’ is more than promoting technology. Helping people take advantage of technology is empowering them in new and different ways, and this includes people inside the organization as well as its customers. 

Take a look at this new report, get inspired, give feedback.


elaine cohen, CSR consultant, Sustainability Reporter, HR Professional, Ice Cream Addict. Author of Understanding G4: the Concise guide to Next Generation Sustainability Reporting  AND  Sustainability Reporting for SMEs: Competitive Advantage Through Transparency AND CSR for HR: A necessary partnership for advancing responsible business practices . Contact me via www.twitter.com/elainecohen   or via my business website www.b-yond.biz   (Beyond Business Ltd, an inspired CSR consulting and Sustainability Reporting firm

Wednesday, July 23, 2014

A new era of collaboration and innovation for GRI

GRI this month welcomes a new Chief Executive, Michael Meehan


GRI's announcement states:

Mr. Meehan’s appointment comes at a crucial juncture for GRI and for sustainability disclosures. In an evolving sustainability reporting landscape, Mr. Meehan will lead GRI in working with new methodologies such as those on natural capital and around integrated reporting, and will drive GRI’s collaboration with global reporting frameworks. He will guide the organization in achieving its mission of making sustainability reporting standard practice worldwide, and promoting the role of sustainability disclosures in addressing global sustainability challenges.

Sounds like Michael is going to have a lot on his plate. And certainly, he has a strong legacy left by Ernst Ligteringen who has done a sterling job leading GRI in the face of many challenges over the past 12 years. After chatting with Michael, I am left with optimism that he will know how to embrace the value that GRI has created while skillfully navigating new themes in the zeitgeist of sustainable development and the needs of sustainability disclosure. It's a complex map, and the sort of practical entrepreneurial spirit, driven by clarity of vision and collaborative orientation that Michael Meehan brings, seems to be the right mix. I wish MM warm congratulations on his appointment and good luck as he takes up residence in GRI's Amsterdam hub. 

As Michael takes up his role, I am sure the word strategy will feature quite a lot in the first few weeks and months. I am sure that everyone will be wanting to know what his priorities are, goals, targets, new ways of doing things, more of this, less of that, new broom and all that. I expect there will be quite a few who have some advice and recommendations, seeing a new chief as a new opportunity to get some things straight and promote an agenda. Allen White was top-speed off the mark in an open letter to MM published in the Guardian (I always wondered about the point of open letters...seems a bit oxymoronish to me) in which he lays down his priorities for the new boss. I expect there will be plenty more open, closed and ajar letters that attempt to influence the new boy on the block as he scans the landscape. However, for me, what's more important than giving Michael Meehan my views about where he should lead GRI, is getting to understand who he is. I am interested in knowing more about what's important to Michael and what motivates him, because that will influence what he does at GRI. (Anyone who doesn't like ice cream, for example, would be a complete non-starter, as far as I am concerned. Happily, this is not the case with Michael Meehan).

I was privileged to have some time to chat with Michael on the phone today...and am pleased to be able to introduce him to the CSR Reporting Blog readers, and share a bit about his thinking as he takes up his new role.   

Michael Meehan At A Glance
Michael or Mike? Michael
Born in? Antigonish, Scottish Gaelic: Am Baile Mór; "The Big Town" but we called it antigonowhere.
Star sign? Scorpio
Top breakfast food? Dutch waffles (called Stroopwafels in Holland)
Last movie you saw? Whatever was playing on the plane last time
Currently reading? Stacks of organizational material about GRI
Most like about Amsterdam? Cycling
Fave social media channel? Google + because I need way more than 140 characters to express myself.
Fave wine? Amarone wine cause it’s got the grit. Not filtered. There are twigs and stuff at the bottom but it tastes great.
Fave place to scuba dive? Scapa Flow.
Fave TV show? Don’t even remember the last time I watched TV
Fave Superhero? Underdog
Fave ice cream flavor? Moose Tracks. Best one going.
Scared of? My kids not knowing what I do for a living.
One thing most people don't know about me is….. In a former life I was actually a scuba diving teacher.

Michael Meehan and what's important

What's most important to you as you take up your new role?
What's most important to me, I think, is the same as what's important to most of us. We are all working to the same goal of a sustainable future.

The reason I am here is to help strengthen GRI's role as a driver and integrator of sustainability disclosure. The reporting landscape has changed, not necessarily unexpectedly, but it has changed. It is shifting rapidly, and that's a good thing. GRI is moving toward a standard-setting approach. This is an evolutionary step that GRI has been considering for some time. The emergence of other frameworks is also evolutionary. The perception out there is that these frameworks compete. But they do not. There is no competing version of materiality – there are different internal contexts that may apply, but this is not competition. 

The thing that differentiates GRI is that it is a strong network that we can leverage to increase collaboration and innovation to create new frameworks. There is a perception is that more frameworks are bad. I don't see it that way. More frameworks are good. We want to see more frameworks that help corporations manage governance and disclosure more effectively in ways that move them forward. GRI has always been that network in the middle that helps things come together.. a sort of backbone of sustainability disclosure, holistically capturing all of the universe of things in CSR reporting that need to be addressed. No one else is doing this. My interest is to strengthen that backbone to improve collaboration and facilitate innovation. We can learn from industries – such as the technology industry – that has done this well and apply those learnings to the sustainability disclosure landscape. GRI is an inclusive framework. We can build on this.

Who are the key stakeholders that you will be looking to engage and work with as you take up your new role?
The world of stakeholders, for GRI, is expansive and we have to move forward on several fronts as we target to strengthen our collaboration and innovation in sustainability disclosure. We will set our sights in working more closely on the labor and human rights side, and supporting new regulatory initiatives relating to reporting, while continuing to build our international leadership. I'll be reviewing the excellent relationships that GRI has maintained so far and looking to accelerate and broaden the momentum in areas that support improved collaboration and innovation.

What has been your interaction with GRI to date?
I have been familiar with GRI for ages. In fact, early on in my career, I invented one of the first carbon management platforms, to help companies calculate and manage their carbon footprint. This was part of the emerging sustainability disclosure world at that time. The first things clients would ask was: how does this fit with reporting frameworks such as GRI?  That was my first taste of sustainability reporting - using a data collection and reporting framework to help companies improve their impacts. 

What do you see as the biggest opportunities for expansion/acceleration of sustainability reporting? 
The number of reporting entities is increasing rapidly. There's no doubt about that. At the same time, there are concerns about the quality of reporting. Part of our role at GRI is to help drive not only widespread acceptance but also help improve the quality of reporting overall. That's one opportunity. Another opportunity is in the area of helping remove the confusion that exists in the area of competitive frameworks. Other frameworks for sustainability disclosure understand the need for collaboration but from the outside, this looks like competition. I have already spoken to the leadership of several other frameworks and I hear a genuine desire to collaborate. We have to build on this desire and make collaboration more apparent and transparent to all those who are watching what we do and are affected by what we do. This challenge has been met time and time again in other industries. It can be done.

What are the specific skills you bring that will be of most use to moving GRI forward in the next phase?
One of the key things is related to my point above. One of the areas I specialize in is helping markets come together. One of the things I love most is being in a place at the time when everything starts to coalesce and helping it happen. I have experience in this area. It's what I find most challenging and most rewarding. There may be lots of different interests but everything has the same goal. That's the skill set that I bring to the table, and that's my focus. The outcome is for GRI to get through it with a stronger backbone. The work we are doing on standards is a part of that. We need to focus more on how people are reporting, how we interconnect with other frameworks and how we define the architecture of the reporting landscape. GRI is the only de facto sustainability metrics framework in the world. We can play a very significant role here.

The second thing that I bring is my experience with developing and using technology. The ability of organizations to capture data and information in reports is now facilitated through technology. At one time, it was impossible. Now, technology enables you to get data very quickly, cut it up in different ways and reuse it in different formats to meet different reporting requirements. A GRI report is an incredibly robust source of data and this fits very well with many aspects of corporate governance. I believe I can help advance the use of technology in reporting that will help companies become more efficient in the way they report and also enhance innovation in the reporting market place.

What can we count on from you as GRI's new chief exec?
You can count on my mantra: collaboration and innovation. I'll be looking to drive better outcomes for GRI and for all of us in the field of sustainability reporting. Communications is a big part of this. We need to make sure everyone knows what's going on. 

***********

Sounds good to me! Collaboration, innovation and Moose Tracks. I confess that I had never even heard of Moose Tracks ice cream flavor. I am going to have to track some mooses down in the very near future. At the same time, I will be sending positive vibes through cyberspace all the way to Amsterdam in support of Michal Meehan and the other capable folks at GRI, hoping to see the fruits of collaboration and innovation in better sustainability reporting in the coming years. 


elaine cohen, CSR consultant, Sustainability Reporter, HR Professional, Ice Cream Addict. Author of Understanding G4: the Concise guide to Next Generation Sustainability Reporting  AND  Sustainability Reporting for SMEs: Competitive Advantage Through Transparency AND CSR for HR: A necessary partnership for advancing responsible business practices . Contact me via www.twitter.com/elainecohen   or via my business website www.b-yond.biz   (Beyond Business Ltd, an inspired CSR consulting and Sustainability Reporting firm

Saturday, July 19, 2014

How to grow revenues by connecting women

I am often asked, by clients or people I meet in the course of my work: What is the difference between embedding CSR into business decisions and doing business that improves sales and profits, provided its ethical? When you talk about embedding CSR into business decisions, its hard to know where business stops and CSR sets in. After all, both should lead to better business results. How can you know when a business decision has integrated CSR principles, or if it was based solely on goals of delivering income and profit growth? Doing "good" business, beyond philanthropy and community investment, is just doing good business. Or is it? 

I often answer this question rather simply, in a way that more or less aligns with the direction described in the Big Idea of Porter and Kramer, who explain: 

"The solution lies in the principle of shared value, which involves creating economic value in a way that also creates value for society by addressing its needs and challenges. Businesses must reconnect company success with social progress. Shared value is not social responsibility, philanthropy, or even sustainability, but a new way to achieve economic success. It is not on the margin of what companies do but at the center."

My answer, then, is about the considerations involved in developing new business initiatives or products. If it's about selling more to create economic growth (which is, in general, a good thing if business is done ethically), then this is hardly embedded CSR. Economic growth alone, as we have seen, does not always produce equitable social benefit and even risks perpetuating many of the global divides - poverty, malnutrition, access to medicine etc - that society faces today. Embedded CSR means approaching business development in a different way, that includes an assessment of the social and environmental impacts of potential decisions, and the social and environmental imperatives in the markets where a company operates. In making such decisions, then, economic considerations as well as social and environmental considerations share valuable weight in the decision-making process. The outcomes are measurable benefits to business, to the economy and also equitable social advancement. 

So far, I suspect, there's not much new here for the rather enlightened readers of this blog. Most of you already will already be familiar with shared value and integrating CSR type concepts. So let's get to the point. It's this. Vodafone. Mobile Technology. Economic Empowerment. Measurable Outcomes. Connected Women.

Earlier this year, Vodafone published one of the most fascinating reports I have read in a long while about the effects of mobile technology on women's empowerment and improvement in the quality of life. It's called: Connected Women. This actually missed my radar a few months back when it was launched, in March, at a Vodafone Connected Women Summit. Better late than never, I guess, and what's more, it's still relevant, of course. I learnt about it this week via an item from IndiaCSR, reporting the launch of the Connected Women report in India by Cherie Blair. 


The report is the summary of research for the Vodafone Foundation conducted by Accenture Sustainability Services. In addition to assessing the impact of increasing mobile ownership among women, Accenture modeled the potential social, economic and commercial impact of five services in the areas of education, health, safety, work and loneliness in 2020. These services are: 

1. mobile learning for adult literacy 
2. Text to Treatment: using mobile payments to cover travel costs to receive maternal healthcare 
3. an alert system for women at high risk of domestic violence 
4. a mobile inventory management system for rural female retailers 
5. new services to connect elderly people to their family, friends and carers.
The research ran in 27 markets around the world where Vodafone does business.

Conclusions are summarized in this infographic below, with the overriding message that the services Vodafone provides in the markets where it does business could enable 8.7 million women to improve their lives. Around the world an estimated 300 million fewer women than men own a mobile phone.  


I guess we all know that mobile technology can support education, health, safety and work so it is clear that improving access in these areas will have social benefits. The Vodafone reports looks at each of these issues in detail, and in relation to the special opportunities that women could enjoy, providing perspectives, data and impacts. There are some very compelling examples. The thing that I found most eye-opening is the issue related to loneliness. I guess, at some level, we know that phone and internet can help older people feel connected. We have all heard the stories of delighted grandparents who sent their first email to their grand-kids. But loneliness as a social issue is perhaps more real and more extensive than we imagined. In Spain, for example, 38% of people over 65 that live alone or have limited mobility report feeling lonely, the research shows.

"Loneliness and social isolation in old age can lead to sadness and anxiety and can even affect physical health. It is particularly a problem for women, since they are more likely to live longer and to live alone in old age."

Vodafone's initiatives in this area meet such real social needs - perhaps even ones that haven't yet been fully articulated - and open up opportunities for great business. Vodafone cites a potential $1.7 billion annual economic benefit to society in 2020 through reduced healthcare costs and informal carers being able to return to work. This translates into a potential $450 million cumulative revenue for Vodafone through 2020. Just by helping older women feel more connected.  

One of the neatest things in this report is the summary of findings and impacts. 


In each area, there is a clear benefit for society and a clear revenue opportunity for Vodafone as a result of empowering women through technology. The report closes with four recommendations, that place focus on doing business differently, engaging in partnerships and considering new business models.

Focus on women’s needs and preferences: Only by understanding their different needs as well as user preferences in each market, can operators provide the tailored services that will be valued by women customers. 

Local implementation with relevant partnerships:  Operators will need to work in partnership with NGOs, partners and funders to launch programmes at scale. Working with local partners will enable operators to leverage their expertise and networks to reach more women more effectively. 

Explore new models and funding options: Different economic models would be required to deliver the different services at scale. An estimated $900 million in donor funding would be required to achieve wide uptake of the modelled services in health, work and education in emerging markets. The mobile learning and Text to Treatment services are likely to require ongoing, large-scale donor or public sector funding. Nominal fees for services to recover development costs and public sector investments could contribute to these costs in some circumstances. Other services, such as those focused on work, safety and loneliness, have the potential to be self financing or revenue generating. 

Use local infrastructure and existing technologies: Combining projects with existing services, for example the M-Pesa mobile money transfer system, or infrastructure, such as local healthcare networks, will significantly improve reach and effectiveness.

Back to the question of how to define embedded CSR / shared value, it seems to me that this is an example of exactly that. It seems to me that Vodafone is quietly pioneering new business models and innovative ways of combining social needs with business development. 

It just so happens that I am currently reading Alice Korngold's excellent book, entitled: A Better World, Inc. In this book, Alice focuses on many of the ways that companies (including examples from Vodafone) are engaging in this new economy and achieving success through addressing social needs. In fact, Alice makes the point that "only global corporations have the resources, global reach and self-interest to build a better world". She says: 


In combination with a fundamentally RATS approach (responsibility, accountability, sustainability, transparency), corporations have the potential to change our lives for the better. This Vodafone example shows how. 


elaine cohen, CSR consultant, Sustainability Reporter, HR Professional, Ice Cream Addict. Author of Understanding G4: the Concise guide to Next Generation Sustainability Reporting  AND  Sustainability Reporting for SMEs: Competitive Advantage Through Transparency AND CSR for HR: A necessary partnership for advancing responsible business practices . Contact me via www.twitter.com/elainecohen   or via my business website www.b-yond.biz   (Beyond Business Ltd, an inspired CSR consulting and Sustainability Reporting firm

Tuesday, July 15, 2014

120 Sustainability Report infographics

Trending: infographics in sustainability reports. As our collective attention spans contract to the point where a quick glance at anything competes with the multitude of quick glances that determine the way we process content today, sustainability reports are catching up. Not yet quite at the level of being written in tweets and hashtags, any self-respecting sustainability report in the current visual age must nonetheless convert messages into pictures, numbers into equivalents, good and bad into ticks and crosses, ideas into light-bulbs, communities into talking heads, environment into leaves and globes and "more info" into magnifying glasses. Icons, arrows, bullets, spotlights, avatars, logos and all things digitally visual are good game in the new era of sustainability inforeportographics. 

What is an infographic? I found this neat description on Visual.ly:

"They're data visualizations that present complex information quickly and clearly. Think of maps, signs, and charts used by statisticians or computer scientists: Wherever you have deep data presented in visual shorthand, you've got an infographic. Infographics are important because they change the way people find and experience stories -- especially now, when more and more infographics are being used to augment editorial content on the web. Infographics create a new way of seeing the world of data, and they help communicate complex ideas in a clear and beautiful way."

By the way, you can find a great sustainability concepts infographic page on Pinterest, curated by the brilliant Julie Urlaub of Taiga Company. Some are really really really nice.

However, as with reports themselves, there are good inforeportographics and there are bad inforeportographics. What makes an infographic better than the rest? I haven't found a conclusive answer to that one, but I did find the best 83 infographics on the web, published by Creative Bloq last year. There you can find infographics about everything imaginable, including the Apple Tree, depicting Apple products through the ages, Twitter psychology, an interactive infographic to calculate the distance to Mars, Superman costume changes over time (one for my 12 year old son, a Superman wannabe), the current state of social networks (this time for my 16 year old daughter who even dreams in Whatsapp)  and even a sustainability related infographic about the growth of green technology from the World Bank. After reviewing all of these infographics, I am now an expert haha!  The things that I look for in an inforeportographic are:

  • I get it - it's quick and easy to understand
  • I love the colors
  • It's really creative
  • It's compact
  • I don't have to squint to read it
  • It complements the report narrative well

There are a few distinct types of infographics that we can find in sustainability report. First, the most popular, are the ones that summarize performance highlights across a range of metrics, hoping that adding a few icons to the numbers will make the numbers more palatable. Then there are those infographics that turn simple graphs into works of art - so fifty thousand people becomes lots of little talking heads all across the page, or $50,000 becomes loads of little money bags. Other popular graphics are used to show the supply chain, or the value chain, in a cool way. Then there are infographics that tell stories, supporting case studies in reports, or trying to. Finally, there are infographics that do nothing more than add color to a page or highlight a number or two in big and bright colors.

Here's a collection of 120 infographics of all shapes and sizes from 23 reports of all shapes and sizes. If it doesn't add up to 120, blame Blogger. I also looked at more than one hundred other reports in order to make this selection, and could have looked at hundreds more. So if I have missed any really really really great designs, well, sorry.


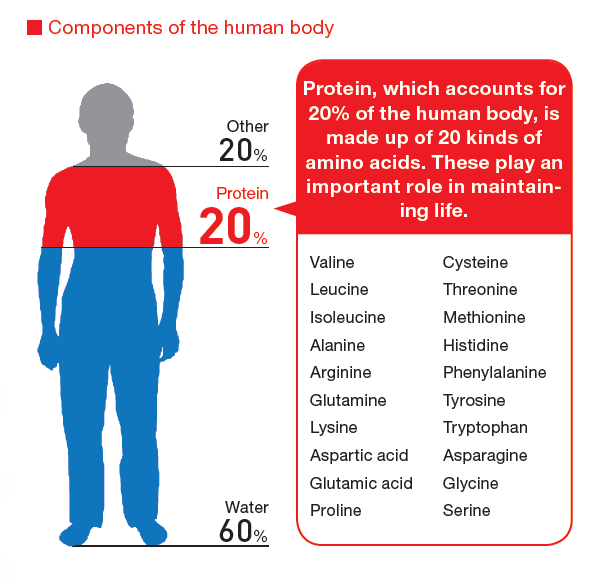
I sometimes think that infographics were invented in Japan. Maybe they were. It's hard to find a Japanese sustainability report that doesn't infographicize almost every topic on almost every page. Ajinomoto is one of my favorite Japanese companies and reporters. This 132 page report uses every possible infographic technique available, ranging from the simplest set of numbers to the most complex technical descriptions, and from the use of designed visuals to actual photos. Case studies are also presented in part-narrative, part-graphic part-photo format. It's an inforeportographic combo that is a microcosm of the total infographic content of almost all the other reports I have reviewed. On the whole, it's nicely done. The infographics by and large add value to the narrative and help create focus which, in a report crammed with information, breaks up the narrative and adds a little breather here and there. Most of the graphics are interesting, and cleverly done. I have selected only a few - there are looooooaaaaads more.


This is the only report I found that really uses real genuine exactly-what-you-mean-by infographics as an art form in this sustainability report. There are several really interesting and creative graphics presented in the report that you need to view in full online. The screenshots in the report are not very legible. Of the hundred and more reports I reviewed to prepare this post, this is the only one with a real infographic set, rather than inforeportographics that are prepared specially for reporting and are far less complex. Nice touch.  


I had to cover Asus because for years I have used only ASUS laptops for me and my team at Beyond Business. I just think they are the best. There's nothing nicer than getting a new ASUS. I love laptops. Oops, I digress. ASUS also designs a nice sustainability report with a few well chosen infographics. Not quite as heavilly laden as most Asian reports, but well-spaced and well-placed.


Couldn't do such a loooong post without any ice cream at all. Ben & Jerry's is one of the original CSR reporters, and their current reporting style is one long scroll-down, with a few links to extended stories. However, graphics play a part and even the title is a sort of inforeportographic. The performance graph is nicely creative, complete with bananas, cage-free eggs and chunks and swirls.


Not really much to learn from this report in terms of infographics aside from a few oilrigs, a terminal hub and lots of data points throughout the report accompanied by an icon in a circle.  But I was interested in learning a bit about Azerbaijan so I decided to take a look. 


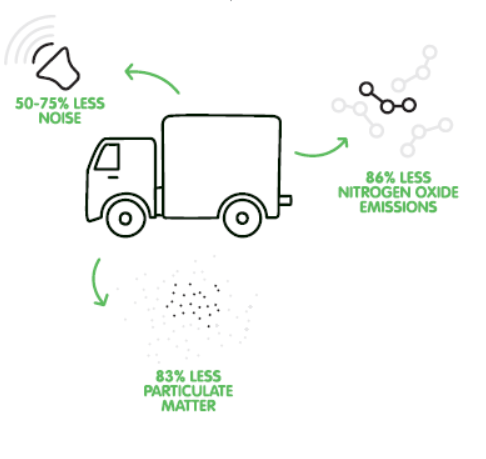
Coca Cola always designs a great report, or designs great a report. Whatever. Fun, bold colors, bold graphics that well suit the brand and its message. Inforeportographics in this report make it more fun to read. They are used primarily to pull out the hot numbers in different sections, through there are a couple that are about processes, such as a nice colorful supply chain diagram. A small selection below from a larger collection in the full report.


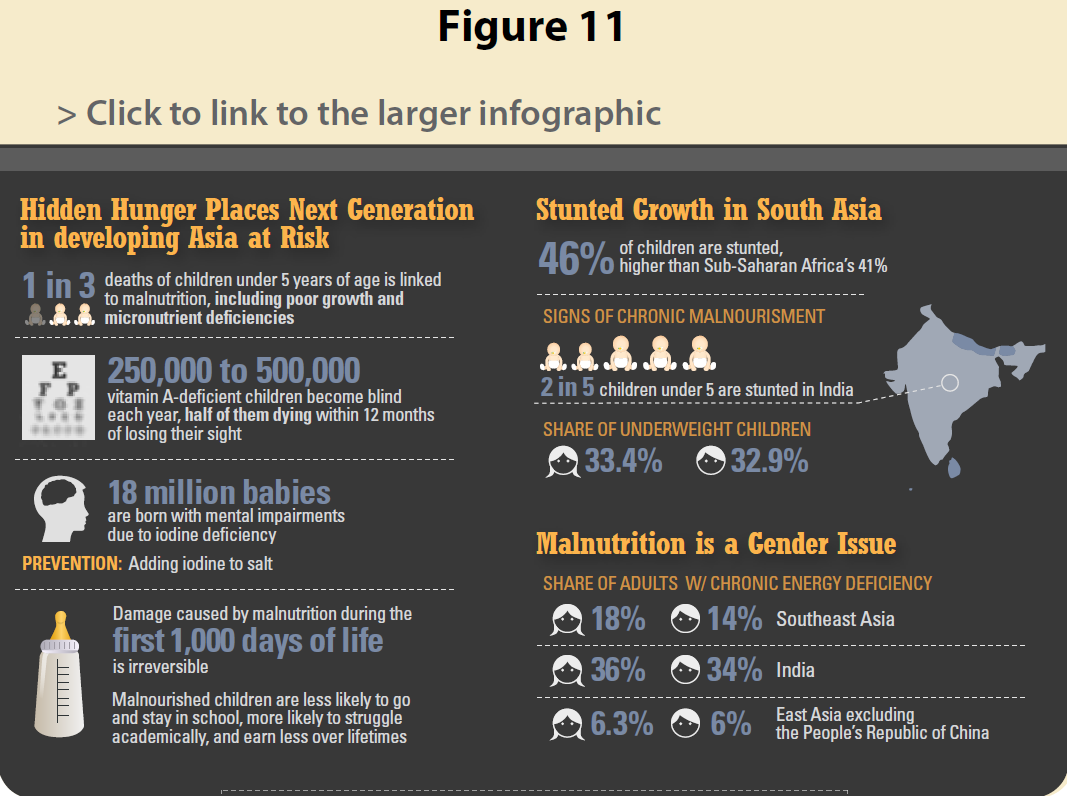
Comcast's report is low-key infographically-speaking. Just two basic designs, with simple stat pull-outs. One has icons, and one has icons and photos. They are mainly separate from the narrative, on landing pages, so they don't really hit you between the eyes. The text-to-number ratio in the visual is more info than graphic, which sort of defeats the purpose. I didn't trouble myself to read the small print, so I was sort of left with a load of unconnected numbers in my head. Not sure I understood how all the icons connected to the numbers. A few examples here:


The Cooperative Group report is not one designed around infographics, through the narrative is supported by small pull-out boxes and captioned photos that illustrate the narrative and catch the eye. There are a couple of pull-out stats infographics at the start of the report, but where this report comes into its own is with two really creative infographics that show how the green store model works and how the distribution center model works. These are fun to explore. You have to read them at 200%, but it's a little compelling. The design makes you want to know what's going on in that green store, and how that distribution center really did earn its "excellent" BREEAM rating.


Delhaize's report is designed with a simple straightforward appeal and it's clear to read and understand. The design complements the overall tone of the report. Delhaize has icons for every part of the sustainability program and target subset. The use of infographics is equally simple and neatly done. Just a few, but just enough.


The summary download report from EMS is pretty much all narrative and pretty much no graphics and no color. With one exception. This inforeportographic. It covers the material issues and a selected fact per item. It may be good as a sort of cheat-sheet for people who work at EMC, but for me, it's somewhat hard to read and the flow doesn't really flow. The graphics don't really tell a clear story, and I had to enlarge to 250% to actually read the explanations on-screen. (OK, maybe it's time for a new pair of glasses).


Everest Textiles's report is a bit of a design pick'n'mix, with no clear theme for the design element, and therefore the small selection of infographics, mainly used to explain technical concepts are individual and not part of a coordinated design theme. As singles, however, each one tells the story it needs to tell, in its own way. 
 
Question: What do 51 little round purple blobs have to do with ISO 14001 certification? Answer: Ask the FedEx Citizenship Report designer. Haha. I am sure there's a sophisticated design thought in there somewhere, but it's out for lunch at the moment. FedEx doesn't go overboard on infographics, just on little round purple blobs. 


This legal firm's report is nicely done with quiet but effective use of infographics. The title page is a hyperlinked contents infographic, and the different chapters use big-block graphics to summarize key elements. In most of the infographics, the sub-text is large enough to read without squinting. Worth noting that all women have square shoulders at Freshfields, apparently. In my view, good use of visuals in this report, in the whole.


H&M is another reporter I have tracked over the years as part of my interest in the apparel sector. In general, I like what H&M has been doing in the garment industry and feel the company has made progress, despite the issues we can take up with fast fashion on a range of scores, yes, including Bangladesh. Reporting-wise, H&M has been getting more focused and I like the use of garment infograhics that tell you what's going on with the shirt you wear and the dress you take off the hanger. Aside from this, H&M uses the highlight pull-out big-number stats approach, and a couple of diagrams to explain key concepts. Nicely done, in my view. 


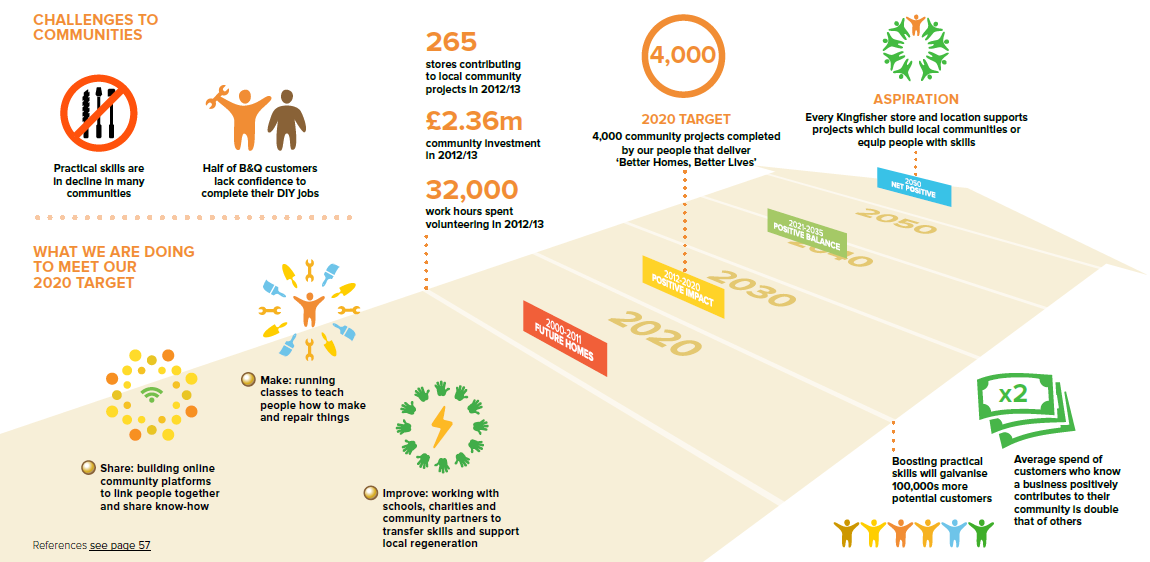
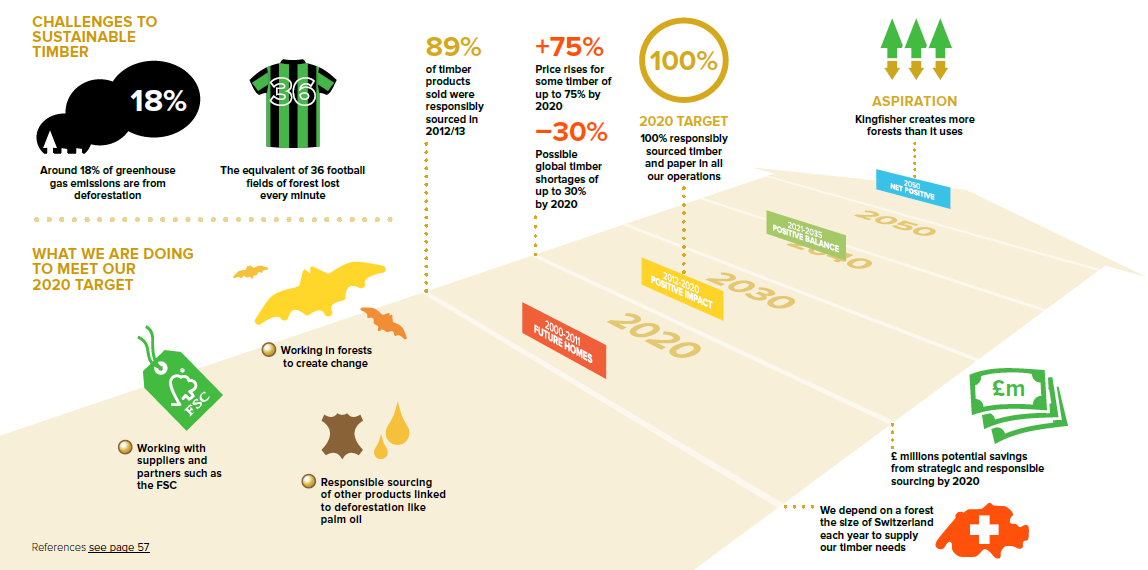
Kingfisher explains its net positive strategy and progress in a nicely visual way, with a main infographic that shows the path to Net Positive in each section. Same style and design, different themes, the graphics are attractive and make you want to read the fine print, of which, thankfully, there is not too much. Kingfisher even has an infographic footnote about infographics.


A great report with great inforeportographics. Thank you to colleague Derryn Heilbuth of BWD Australia, who worked with Lion to help create this report. This report uses infographicism to introduce main chapters and provide an overview of what's to come. The design blends with the report style and overall look and feel. In addition to the overview info's, clever use of design helps make sense of stat bundles. A little packed, they are nonetheless quite engaging graphics, making you want to pause and check them out.


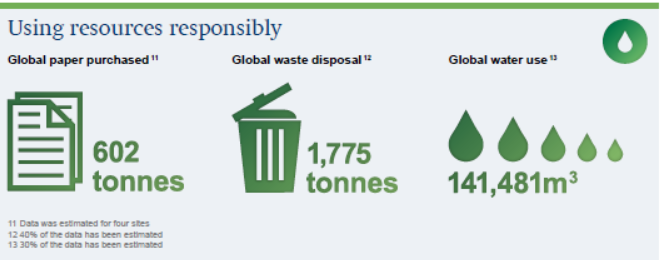
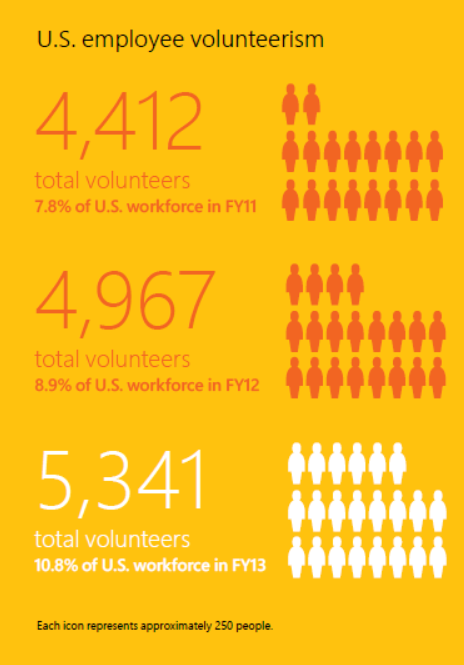
Microsoft hasn't gone overboard with inforeportographics, just a couple on energy and emissions, and one or two less complex representations. Terracotta army features here too in the form of lots of little lookalike volunteers.  


For a technology company, Mindtree's infographics all have a decidedly (surprisingly) spiritual feel. They are all circular and softly designed, subtly calming and smooth. Lots of icons in circles. Infographics here are used to explain concepts and processes, not numbers and statistics. 


Raffeisen Bank's use of inforeportographics is focused and clever. There are five main well-developed graphics, all following the same design line, which also aligns broadly with the design colors of the bank. In addition to a simple overview graphic, there are four invested visuals representing each of the four pillars of the bank's CSR approach and report chapters, showing key data and highlights from the year. Busy but not overly so, colorful but not overly so, infographics complement the report content effectively. I like this!


The 2013 Safeway report is a serious inforeportographic global league contender with a highly polished infographical approach. It opens up with a page of performance highlights, followed with a suite of smaller graphics for different purposes in the report. Some of them work well, some work less well. The icons are well-considered and a little more creative than the stock-icons that many reports just grab so they can stick something next to a number. On the other hand, infographics with line after line of little boy and girl figures, a bit like the Terracotta Army, to represent hundreds of thousands of employees, make me wonder if the designer has a penchant for ancient history. The infographics in this report work well within the overall report design, and help make the report appealing and accessible, just in case any Safeway customers might want to take an interest. I hope they do.


The Starbucks progress update report is fairly low-key design-wise and focused on a simple update of achievements against multi-year goals. Most of this 28-pager is narrative and a few photos, and there are just a couple of small process descriptor inforeportographics, each with circles and arrows. What gets this report on the infographic map, though, is the clever use of design in the progress update charts. Each chart has a little simple but clever visual twist that makes it just a little more attractive than a straightforward numbers bar-chart. I have included a few below but there are more that are worth checking out.


Not too much in the way of infographics in this report, but there are a few functional infographics that help us get past some of the technical aspects of the sustainability management and the mining industry.  I like the water inputs and outputs diagram, hidden inside a green mountain. This report is mainly green, as you may have noticed. 


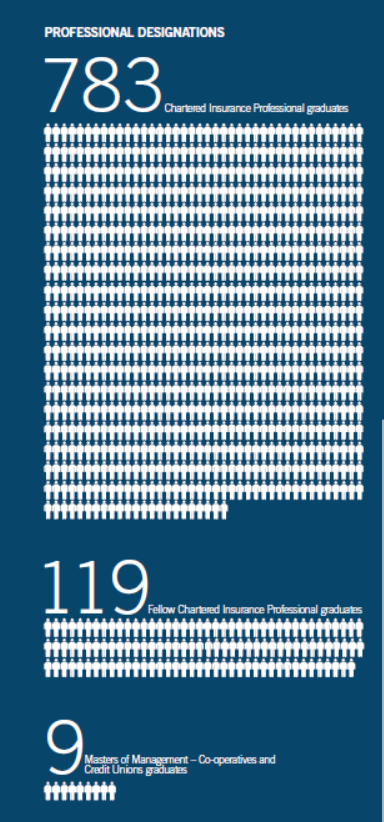
Oh dear, it's the Terracotta Army again. Only one other infographic in this report. The rest is narrative.


That's all folks!
For now....


elaine cohen, CSR consultant, Sustainability Reporter, HR Professional, Ice Cream Addict. Author of Understanding G4: the Concise guide to Next Generation Sustainability Reporting  AND  Sustainability Reporting for SMEs: Competitive Advantage Through Transparency AND CSR for HR: A necessary partnership for advancing responsible business practices . Contact me via www.twitter.com/elainecohen   or via my business website www.b-yond.biz   (Beyond Business Ltd, an inspired CSR consulting and Sustainability Reporting firm
Related Posts with Thumbnails