Showing posts with label database. Show all posts

Thursday, August 27, 2015

The Sustainability Crystal Ball

Don't you wish you could have a crystal ball that would tell you what sustainability issues are coming up to hit you in the glabella? Or somewhere else even more painful? Wouldn't you like to know the issues before your stakeholders turn you into mush? Wouldn't you want to prepare your sustainability strategy knowing that you have covered all the angles and not left materiality to fortuity? Wouldn't you want a little materiality certainty rather than a lot of materiality perplexity? 

The answer to all your wishes just may have come true with a little big thing that calls itself the DatamaranTM. Yes, that's Datamaran, not catamaran. Catamarans are characterized by light weight, high stability, reduced drag and comfort that get you where you want to go. That's kind of what you want from technology too, so the selection of the name Datamaran for a dynamic, interactive, real-time personalizable database of sustainability issues is apparently not entirely coincidental.


Datamaran is the new little big thing for companies who want to be in control of their sustainability journey. With sustainability, there are so many variables that it's hard to stay in on top of what's most important. If you can't see the forest for the saplings, then you might need to cut through the undergrowth. (Am I mixing metaphors?)

Datamaran is the brainchild of startup eRevalue. Marjella Alma, founder of eRevalue, explained it to me: 

"Sustainability closes doors. People look at frameworks and numbers. We should take a step back, relax and then come back to see how the land lies. The frameworks that we use such as GRI or SASB should not be treated as forms you fill in and tick the sustainability “box”. Companies must first and foremost take responsibility for their impacts – “know your business” - regardless of the framework and their prescribed KPIs. But how do this when there’s many initiatives, various opinions, regulatory pressures… and you have a complex value chain?

We wanted to create a tool that would help companies understand and navigate the issues so that they can talk about what's really on the table, not reduce this important effort to “selecting from a set of generic givens”. We asked ourselves how we could put this in front of companies to help them identify emerging issues by country, by sector, by competitive landscape and by regulatory pressures. 

We wanted to help companies know what to talk about and how to establish the right kind of KPIs that are relevant for them, and early enough in the process so that companies are not caught unaware." 

HQ'd in London with a team of 25+ ESG experts, lawyers and data scientists and growing, eRevalue's Datamaran is set for a long and meaningful navigation through sustainaland.  

Marjella makes a lot of sense (She usually does. I've known her for quite a while!) We are being plied and prodded with more frameworks and regulations than we can ever imagine and more and more companies are asking, how can we cut through the clutter? More companies are looking to filter out the noise, as the folks at eRevalue say. Datamaran conjures up a set of emerging issues to be aware of as you assess what's material for your business and for your stakeholders. The issues are driven by what people are really talking about out there, as it happens. The conversations that suddenly explode into viral megaphones are caught at an early stage in the Datamaran clutches, letting you know who's doing the talking and how loud everybody else is shouting. Ultimately it becomes a real-time materiality funnel, shaping the relative force of the issues as the conversations on the radar vary in intensity.  

Datamaran works with complex search algorithms across a taxonomy of 6,000 search terms relating to 120 issues on the sustainability radar, hunting down references in corporate websites, Sustainability Reports, SEC filings, Annual Reports and increasingly, media and social media, starting with Twitter. There is also a regulatory platform where all the regulatory frameworks relative to a particular issue magically pop up, and even indicate emerging regulation that is on the radar. In short, all the things that your materiality analysis needs as you create it and as you revise it. 

For reporting, Datamaran helps you understand what's current right now. Suppose you are a company and you are about to prepare your next Sustainability Report. You have your overall strategy and materiality framework mapped out, but you are interested to know what is on the radar right now for your peer group. 

I couldn't resist having a little play around with Datamaran. (Fortunately it's not catamaran, as I am prone to seasickness). I imagined I was a large pharmaceutical company. I selected in my profile the issues that are currently on my radar and I benchmarked these against global and regional issues for my peer companies in relation to what they report in sustainability reports.


At a global level, I see that occupational health and safety, environmental issues and employee issues are picking up the most noise in terms of what pharma peer companies are reporting in their sustainability reports.    

Drilling down, I was able to get a view of how these issues play our in different regions and the relative noise created by each issue in the current landscape. When I separately benchmarked Europe, Americas and Asia, I got different rankings.

Europe


Americas
Asia
Globally, I can see that 91% of my peer companies mention waste in their sustainability reports - a sign that I had better ensure I'm on top of that too. 


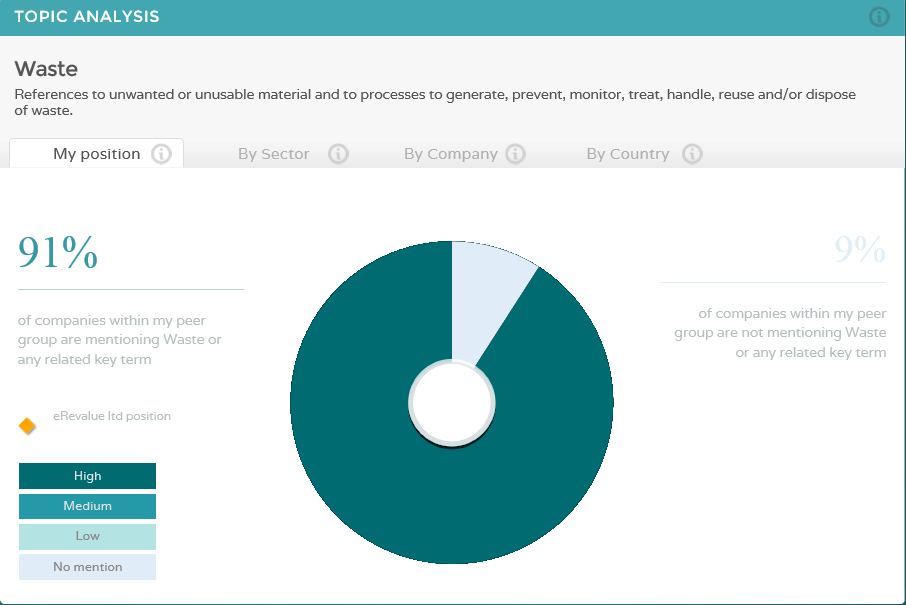
Broadly speaking, the top 20 issues don't change significantly across regions - as I would not expect them to do - but in the Americas, waste comes out top; in Europe, occupational health and safety comes out top and in Asia, workforce diversity and inclusion tops the list. While these results might not be significant enough for me to entirely redraw my materiality matrix, it's certainly interesting enough for me to check out who's saying what in the different regions and why. On the subject of waste, for example, we can see the regulatory landscape of current and emerging legislation quite clearly and for each issue, Datamaran can take us back to the source legislation. 


There are a million other ways Datamaran can be useful.. I have only scratched the surface. In my chat with Marjella, I understand that the busy bees at eRevalue are technologizing away really really fast to expand the applicability and personalizability of the system to make it even more useful. This is apparently the only tool of its kind around to support sustainability material decision making and low-noise focus. 

As with any database, what comes out is only as good as what goes in, and the way the program functionality is constructed. So as long as Datamaran keeps its legs on dry land, it seems that it could be quite useful. I'll certainly keep this radar on my radar....  I always wanted a crystal ball.   


elaine cohen, CSR consultant, Sustainability Reporter, HR Professional, Ice Cream Addict. Author of Understanding G4: the Concise Guide to Next Generation Sustainability Reporting  AND  Sustainability Reporting for SMEs: Competitive Advantage Through Transparency AND CSR for HR: A necessary partnership for advancing responsible business practices . Contact me via Twitter (@elainecohen)  or via my business website www.b-yond.biz   (Beyond Business Ltd, an inspired CSR consulting and Sustainability Reporting firm).  Need help writing your first / next Sustainability Report? Contact elaine: info@b-yond.biz   

Saturday, November 12, 2011

Making Reporting Relevant: Two sustainability databases

As businesses become more transparent, so databases populated with the information that businesses now disclose are becoming more sophisticated and opening up wondrous possibilities for discovery, comparison, benchmarking and all sorts of interesting facts and figures compilations. Hot off the press is the new GRI Database of Sustainability Reports, which is a repository of over 7,600 sustainability and integrated reports (GRI-based and non-GRI-based) which is searchable and offers possibilities for interesting benchmarking options. Another fascinating data base which drills right down to source ESG data, sector by sector, is the new Justmeans Insights platform which is a data visualization and performance dashboard. (see the Press Release here). 

The new GRI Sustainability Report Database is the product of several years work and broad collaboration with the GRI Data Consortium  (my company, Beyond Business is the Data Consortium Partner for Israel). It is still in pilot phase, but is looking pretty good. The Database site was launched officially this week with a press release  and a launch webinar which you can view here (Webex recording). Many bloggers have already rushed to report on the key features of this new database, such as Raz Godelnik on Triple Pundit, and Environmental Leader and Sustainable Planet. Here is an extract from the GRI Press release:

"The new Sustainability Disclosure Database includes data on the sustainability and environmental, social and governance (ESG) transparency of over three thousand companies worldwide. Sustainability performance data is increasingly important to markets worldwide. In 1975, on average 80 percent of a company’s value came from tangible capital – finances and assets. Today, on average 80 percent of a company’s value is intangible – for example customer trust, brand value and stakeholder relations. The database is a hub for sustainability disclosure, featuring sustainability reports that use the GRI Guidelines and those that follow other guidance. The database includes references to sustainability guidance from different organizations, including the Carbon Disclosure Project, ISO, the OECD and the UN Global Compact. GRI plans to expand the scope and depth of its data collection and analytical functionality over time."

The GRI Reports Database

Here is an example of what you can do with the GRI database:

First, you can take an interest in the latest published reports or those which have been featured in the GRI communications service


Alternatively, using the search function, you can search for any report by organization name, report type, publication year, sector, region or country. Each organization and each report has its own profile page. This is currently still being populated (largely dependent on reporting companies completing their own data via own access), but most of the reports are already available to view. However, the benchmarking is where it has the potential to get most interesting ... so far, in the benchmark, only reports published since Jan 1st, 2011 AND which have been checked by the GRI as conforming with the GRI Application levels are included in the benchmark option - that's around 100 reports to date .. so a meaningful benchmark is still a little premature. However, as more reports are included, this could become quite useful. To give you an idea, I looked at 2 sectors which have a more than just a couple of reports : the Chemicals sector (5 reports) and the Energy sector (10 reports).


This chart shows that the Chemicals Sector reports are way ahead in reporting against more performance indicators. To make this clearer, 80% or more of companies report against 78% of the EC indicators, 73% of the EN indicators and only 21% of the LA indicators and so on. In the Energy Sector, overall reporting by most companies is much lower, showing that 80% or more of companies report against 22% of EC indicators, 23% of EN indicators but much more against LA indicators with 43%. What is it about the Chemical Sector that causes a dip in Labor Indicators, and the Energy Sector which makes that set of indicators more relevant? The GRI Database won't tell us that but it does allow reporters and report-readers to gain new insights and consider interesting questionsabout how companies report.

This basic analysis of just a small sample of the database took quite a lot of manual calculation. The data cannot be exported so analysis is manual. However, for companies looking to benchmark their sector, or country or region to see who is reporting what, the database could provide a very useful guide (once it is more fully populated). Companies wishing to do a deep-dive analysis can go back to the source reports for each indicator and check on who said what. 

Useful Now but More Useful in the Future

The benchmarking database does have its limitations. It doesn't show actual performance data nor assess the quality of the disclosures against any indicator and despite the GRI Application Level Check, there remain great discrepancies in reporting quality, as we all know. The linkage of the benchmark data doesn't easily hook back to the level of the reports themselves - to know if the benchmarked group reported at GRI Level A, B or C requires going back to each of the individual report profiles in the benchmark and checking that out individually.  

Therefore, in the initial stages, until more functionality is added, the main advantage of the database is the growing collection of reports in one place and a basic overview of what companies are reporting on most frequently. This has been a massive undertaking and congrats! to the GRI for coming so far. This is a database to watch in the coming months. I am sure it will become more relevant as it matures.

Justmeans Insights Platform - Another Layer of Transparency

The other database that is worth watching takes transparency a step further. Data Visualization from the Justmeans platform is quite spectacular. Take a look at this blog post by Harry Stevens to get an impression of what the platform can do. The Insights platform uses data collected by the CRD Analytics Global 1000 Smartview (R) 360 methodology (which powers the Nasdaq OMX Sustainability Index) for sustainability reporting companies with market capitalization of at least $1 billion. Insights makes a wide range of performance data available sector by sector, in comparable form with instant graphic visualization. So far, three sectors are available (Pharma, Computers and Peripherals and Semiconductors) and over time, more sectors will be added. This presupposes that analysis by sector is the way to go and there is some merit in comparing apples with apples, or in the case of the Pharma industry, drugs with drugs.

How Do Pharma Companies Compare?

There are 24 companies in the Pharma database, with Allergen shooting up to first place from seventh place in 2009, edging out Novartis from the top spot (now ranked 6).

Looking at the indirect energy consumption of 4 companies in this database, the figures show that in 2010, Merck actually used more total indirect energy that the other benchmarked companies, overtaking GlaxoSmithKline by a short measure.


Converting this to an intensity measure, gigajoules per $US million revenue, we get different picture. Merck and Glaxo are about equal in indirect energy intensity, while Allergen, who ranks number one overall in ESG performance, shows much higher in energy intensity, exceeding the much larger company, Roche.


Roche, Glaxo and Merck are all similar in terms of revenue size ($40-50 billion) while Allergen is much smaller with $US 5 billion.

Instant Relevant Benchmarking

This is a fascinating and instantly useful compilation of ESG data in a way which enables the perspective and context of relative performance accross different companies. Absolute energy consumption is affected by so many things beyond internal processes - size of production facilities, acquisitions, growth in production etc. - though ultimately, it's absolute measures which make a difference to the sustainability of the planet. By looking at absolute figures, you can see how companies' impacts have changed over time. In the first chart above, for example, data shows that Glaxo has been slightly reducing consumption year on year while Merck took a big jump from 2008 to 2010 (probably due to acquisition of Schering Plough). The other data you can pick up is which companies are not reporting on certain ESG indicators- which also tells a story.  The intensity comparison gives the picture of where companies are in their peer group - I selected to include only 4 companies in the charts above - but it is possible to benchmark all or any selection of the 24 companies in the sector for every single performance indicator. ESG areas covered include environmental, social (workforce, human rights etc.) and governance data. 

Making Reporting Relevant

Taken together, the GRI Reporting Database (free) and the Justmeans Insights Dashboard (subscription) are a major step forward in our ability to make sense of the much broader sustainability transparency that we are experiencing these days. The KPMG 2011 Reporting Survey, published to coincide with the database release,  confirms that sustainability reporting has become  the "de facto law" with 95% of the G250 now reporting. Reporting quality aside, GRI and Justmeans are now offering tools to help us make sense of it all. And when it makes sense, it will be much, much more relevant.


elaine cohen, CSR consultant, Sustainabilty Reporter, HR Professional, Ice Cream Addict. Author of CSR for HR: A necessary partnership for advancing responsible business practices Contact me via www.twitter.com/elainecohen  on Twitter or via my business website www.b-yond.biz/en  (BeyondBusiness, an inspired CSR consulting and Sustainability Reporting firm)
Related Posts with Thumbnails