Showing posts with label index. Show all posts

Thursday, November 13, 2014

7 short CSR reports - the better and the less better

I was asked by @jenniferwoofter on Twitter if  I can recommend any short reports - under or around 20 pages - that are effective in communicating sustainability. I always have a problem remembering where I found good reporting practice. I ought to develop a system. (Note to self: that to-do list just keeps getting longer). So, in order to respond to Jennifer, and refresh my thinking, I did a little research using the GRI Global Reporting Sustainability Database. It's very hard to find reports that are under or around 20 pages (excluding executive summaries of longer reports) (and, of course, I only look at reports in English (or sort-of English)). It's almost impossible to find short reports in Asia or Latin America and most of Europe. Shorter reports tend to be from U.S. companies. Also, short reporting does not correlate absolutely to company size. It's not just SMEs and local companies that keep reports compact. My list below includes some large global companies with tens of thousands of employees.

Here's what I came up with - the better and less better. I will say that even the less better reports are evidence of some level of commitment and action and while my, as usual, fairly direct criticisms reflect my honest professional opinion in the hope of helping reporters get better value from reporting, I continue to commend and be grateful to companies who report. Reporting is always a challenge and always an achievement. Even short reports can be powerful. Some more than others.

The better

GRI Application Level C, GRI checked, 12 pages excluding GRI Index

Datwyler Cabling Solutions is a supplier of system solutions and services for electrical and ICT infrastructures in public and commercial buildings and in data centers and networks.This is a report for a medium-sized business (less than 1,000 people) that really does the job. It's short, no frills, no stories and no case studies, but it covers the ground and credibly represents a sustainable approach with just about enough data to make it meaningful. Don't look for more sophisticated reporting content, such as a materiality matrix or impact assessments, but for the size of the organization, the report is a simple, concise and clear communication of the organization, its values and its approach in practice. As short reports go, I like this one. 


Sanoma CSR Report 2013, Finland
GRI Application Level C report, 22 pages including GRI index.

Sanoma is a media and learning company based in Finland with operations in several countries and almost 11,000 employees. Sanoma is publicly listed in Finland. This report is delightfully colorful - as we might expect from a media company - and the social mission is clear. "We help people access and understand the world" and the passion "actively shaping the world around us" is well projected. The report is structured with people first (how many reports put people last?), then responsible business activities, then community, then environment. It's an interesting read, although a bit too general in places. The attractive design helps the flow. One thing that is missing, though, despite a tick of the box in the GRI Content Index, is a statement from the leadership. No CEO or General Manager. Maybe this is because Sanoma is just one big team, but without a leadership statement, this report lacks a bit of punch for me. However, it's a good report certainly one of the better shorter ones.

Downer 2013 Corporate Responsibility Report, Australia
GRI Application Level B+, 21 pages, excluding GRI Content index but including Assurance Statement.

Downer is a mining, infrastructure and rail company, listed on the Australian Stock Exchange. Downer employs more than 20,000 people and operates primarily in Australia and New Zealand. This report packs a punch for its 21 pages. It's compactly designed and I love the photography of what appear to be real people that work at Downer and not stock photos of anonymous citizens of the world. The CEO statement is short and to the point and actually evidences some element of strategic thinking. Disappointingly, although Downer attests to following a materiality process, material issues are not listed explicitly, but are said to be the basis for the report content. Data is nicely presented and a few short case studies add to the credibility and interest in this report. Some stakeholder voices are included (internal). The report is well-written and easy to read. This is probably one of the best short reports I have come across.


The less better

A&E 2013-2014 Sustainability Report, USA
Non GRI report, 16 pages

A&E is a provider of threads and yarns for the global fashion industry. It employs more than 10,000 people, a fairly large organization, something you wouldn't guess from the format of this report. This is a home-made report in word format that is rather difficult to read due to the awkward formatting, errors and inconsistent language style. The CEO statement is rather platitudy and weak, although the company does provide evidence in a short 16 pages of sustainable practice. A&E presents Ten Threads of Sustainability and shows a long history of data on environmental impact reduction. However, while the delivery of a report is always a good thing, and far better than not reporting, this report lacks balance, structure and relevance. I am sure that a stronger investment in the reporting process and output would deliver greater value for A&E.


Williams-Sonoma Inc. Corporate Responsibility Report 2013, USA 
Non-GRI report, 22 pages

This is a approach and story-based report that projects a strong commitment and a community orientation for this specialty home-products retailer and e-commerce company, with brands including Pottery Barn and west elm and around 600 retail stores. Williams-Sonoma employs around 28,000 people of whom 7,800 are full time. However, it is almost completely devoid of data. Just to find how many people the company employs, I had to search for the most recent Form 10-K. There are a few numbers around sustainable sourcing of wood and expenditure with artisan workers, but not much else. Despite "forging new relationships to advance our energy goals", we are not treated to a peek at what these energy goals are, not any data about energy consumption, or any other aspect of this company's supply chain. In this case, this short report is too short. It's a nice sustainability-oriented brochure but doesn't pass the litmus-test for a CR Report. 


The Carlyle Group Corporate Citizenship Report 2014, USA
Not GRI Report, 18 pages

The Carlyle Group is an American-based global asset management firm, specializing in private equity, based in Washington D.C employing around 1,700 people. In 2013, Carlyle appointed a first Chief Sustainability Officer. This report is about how Carlyle practices responsible investment and through its investment policies, drives increased awareness and advancement of sustainability practices, as well as helping change practices at portfolio companies. Indeed, there are some very positive initiatives in place.  There is  a section on environmental initiatives in portfolio companies, and a couple of pages on community involvement and work culture. Nice stories and snapshots of responsible investment, but not enough quantified sustainability impacts. A sustainability report that presents almost no data is always rather a disappointment. Disclosing approaches, policies and individual initiatives is always better than no disclosure at all, but credibility increases when we read reports that actually describe performance rather than treat us to story snapshots.


Thermo Fisher Scientific 2013 Corporate Responsibility Report, USA
GRI-based report, undeclared level, 12 pages including GRI Content Index

Thermo Fisher Scientific is an American multinational, biotechnology product development company with 50,000 employees in 50 countries and revenues of $17 billion. The report is organized around the three sustainability priorities of the company - business sustainability (process improvement and efficiencies), employee engagement and philanthropic giving. As such, it's what I call a "shopping-list" report - what we did, where we went, how much we donated. All this is very fine, and although a GRI Content Index is included, there are very few performance indicators of substance. For a company this size and of such breadth, with such an important role to play in the world, we might expect a little more depth to the CR approach and disclosure. The report is pleasant, representing early CSR thinking but lacking the maturity of today's sustainability orientation.  


Writing short reports is not a substitute for acting short on sustainability. Where there is little action of substance, a short report will not fill the gap and show the company up as a sustainability leader just because there are some nice stories and policies. On the other hand, short reports can reflect extensive performance almost as well as long reports, if done well. Interestingly, I realize that the reports I found to be more credible and useful were GRI-based. I hadn't specifically tried to demonstrate that GRI reports are better, but perhaps there is something about working to a framework that helps structure the content and flow of a sustainability report. 

Thanks to Jennifer Woofter for asking me about short reports. I love reports of any length  and this was an interesting analysis. You can guess what I am going to do now.... mmm, maybe banana pecan flavor....


elaine cohen, CSR consultant, Sustainability Reporter, HR Professional, Ice Cream Addict. Author of Understanding G4: the Concise guide to Next Generation Sustainability Reporting  AND  Sustainability Reporting for SMEs: Competitive Advantage Through Transparency AND CSR for HR: A necessary partnership for advancing responsible business practices . Contact me via Twitter (@elainecohen)  or via my business website www.b-yond.biz   (Beyond Business Ltd, an inspired CSR consulting and Sustainability Reporting firm).  Check out our G4 Report Expert Analysis Service - for published G4 reports or pre-publication - write to Elaine at info@b-yond.biz to help make your G4 reporting  even better.  

Friday, August 10, 2012

Part Two: Sustainability: What the Numbers Tell You

Since my recent Sustainability: What the Numbers Tell You post was so resoundingly successful, I have decided to maintain the momentum and  take a look at some more numbers. This time I am going to look at environmental metrics that were covered in the Sustainability Practices 2012 Edition, which I fairly glossed over in my previous (resoundingly successful) post. The Report covers a range of environmental metrics including those relating to: emissions, energy, water, waste, recycling, packaging, purchasing and spills and fines. Let's start with this number:

39%
of companies in the Bloomberg ESG 3000 Index report having a Climate Change Strategy. This compares with only 26% of the S&P 500 and 16% of the Russell 1000. (Just to remind you, the Bloomberg ESG 3000 covers a range of global companies while the S&P and Russell indices cover large-cap U.S. companies. So when the Bloomberg is higher than the S&P/Russell, it means that the world is doing better than the U.S.) In this case,  U.S. companies have not yet caught up on climate change as something they need to be making decisions about.

Many people probably don't know the difference between a climate change strategy and reducing energy consumption. In the Sustainability Practices Report, a climate change strategy is defined as: "a set of risk management procedures designed to mitigate the impact on business operations of climate change". Typically, as defined in the report, such a strategy will include: an assessment of the energy efficiency of the business, a commitment to capital investment in environmentally preferable technologies and a search for new sources of capital through commodity trading of GHG emissions or government subsidies for GHG emission reductions. 71% of big companies (over $100 billion revenues) have apparently given this some thought as they do have a climate change strategy. Only 22% of companies under $1 billion have done the leg-work in this area. The rest of them either they have a policy and are not disclosing (unlikely) or they don't have a policy and they are ostriching (likely). That's a shame, because "if you think mitigated climate change is expensive, try unmitigated climate change", (a quote from Dr Richard Gammon) .

And now for a little quiz: How many of the Bloomberg ESG 3000 actually report their total carbon  emissions?
A: 83%
B: 72%
C: 65%
D: 48%
E   34%
F:  21%

Yes, great, you were either wrong or right. The correct answer is:

 34%

That's it. Just over a third of the world's leading companies disclose their total carbon emissions. But this is not really the world's companies - it's Japan. In the Bloomberg 3000, there are 644 companies from Japan of which 80% disclose CO2 emissions, which is required by law. In the U.S., for example, only 8% of the 70 U.S. companies in the 3000 Index disclose CO2 emissions, which is the lowest rate of disclosure across a range of countries. The Netherlands and Sweden do better at 70% and 62% respectively, but France and the UK are lagging with 39% and 30%. This might be changing fairly soon in the UK with new legislation which will require large listed UK companies to disclose GHG emissions.  But disclosure is one thing and sustainable performance is another.  Think about this next number:

16,536,533

which is the average total CO2 emissions in tons from the 36 disclosing companies in the S&P 500 Index. This is a whopping 5 times higher than the total emissions from the 1,033 disclosing companies in the Bloomberg ESG 3000.  Utilities and energy companies reported the highest level of emissions, as you might expect. It takes energy to produce energy, apparently. Double whammy. When normalized per employee, we find that the utilities sector produces 1,473 tons of CO2 emissions per employee (median, not average). This is equivalent to emissions per employee resulting from powering 167 homes with electricity for a full year, or running 262 passenger cars for a full year. Wonder if all those employees think about that on their morning commute: "Hah, wonder how many cars on the road the carbon emissions resulting from my working today will equate to?" Perhaps this could be the next stage in sustainability-driven Employer Branding. It might work for the Financial Services Industry, where CO2 emissions are a mere 3 tons per year per employee (median). "Do you feel you have a personal responsibility for protecting our planet? Come and work for us. Your work will generate only 3 tons of carbon emissions per year, which is less than the equivalent of keeping one car on the road. You can manipulate interest rates with hardly any impact on the environment".  

But, enough of CO2, let's go deeper and look at energy efficiency. Consider these numbers:

 1,933  -  249  -  321

These are the actual numbers of companies in our three reference indices of 3,000, 500 and 1,000 companies which declare that they have an energy efficiency policy. 64%, 50% and 33%. I find that incredible. Forget sustainability, just think about energy costs. Heck, we even have an energy efficiency policy in our home! (Well, I admit, it's not a written policy, but if the kids leave the lights on in their bedrooms, they know there will be unpleasant consequences). Why wouldn't businesses have an energy efficiency policy? Ah, you might say, "companies which are primarily office based have more significant sustainability impacts to think about and more important cost considerations". Ah, I might say back to you, "and pigs can fly".  Even the financial sector, primarily office based as it may be, has a higher rate of energy-efficiency policy disclosure at 52% of companies than the energy sector itself at 46%. Energy efficiency is the second most material issue for companies everywhere, based on a study that was done last year on materiality issues. So how come so few have a policy? Possible they are just doing it because it's in their DNA. (A friendly reference to Oliver Balch, who tweeted "Please, one piece of advice to all companies: ban the phrase 'In our DNA' from your corporate lexicon"). Consider this number:

5%

which is the percentage of companies in the Bloomberg ESG 3000 which report using renewable energy. That's just 164 companies. For all the others, renewables are apparently not yet in their DNA.

Moving on to water consumption, consider this:

3.72

is the ratio of average water consumption in the U.S. based S&P 500 to the average in the Bloomberg ESG 3000. The average water consumption per S&P company in the U.S. sample (104 companies disclosing) is 3.72 times higher than the global sample (1,111 companies disclosing). Clearly, size does matter, as the bigger companies have higher water consumption.  Yet still only 74% of the companies in the $100 million revenue category disclose total water consumption, despite the fact that the median water consumption for this group is over 35 million cubic meters in comparison to a $1-10 million revenue company which uses 1.4 million cubic meters per year. With water scarcity becoming the number one resource issue globally, it seems incredible that disclosure for such large corporate users should not be mandatory, leaving 26% of the largest companies in the world to decide for themselves whether to manage water consumption transparently or not. But it gets worse. Consider this:

2%

is the number of companies which report that they use recycled water. 74 companies in a sample of 3000. But it gets worser. Waste is also one of the big drags on our economies and quality of life, not to mention sustainability. Here's another number:

31,739,944

is the average waste in tons generated by companies in the materials sector (which is made up of companies that manufacture chemicals, construction materials, containers and packaging, paper and forest products, extractives etc) which is more than the total average waste of all the other sectors added together, yet only 36% of companies in this sector report on the total levels of waste generated. Waste is cost. More often than not, it's unnecessary cost. How are investors using this information? Companies which are generating so much waste are also wasting investors' money.  Which brings us to the next number:

$997,299

which is the average amount that companies in the Bloomberg ESG 3000 spend on environmental fines each year. In the S&P 500 index, this becomes a whopping $2,224,831.

I could go on, but I won't. The Sustainability Practices 2012 Edition Report is an encyclopedia of data and comparative numbers. I have given you a jump start. You'll have to do the rest of the leg-work yourself :)  

By now, I think you get the picture. It's one of desperately poor levels of disclosure. Despite the growing momentum of voluntary disclosure and Sustainability Reporting, frameworks, measures, surveys, CEO commitments, investor pressures and all the hype that this brings with it, the picture on transparency is still bleak. Most of the largest companies in the world are barely disclosing most of the most important sustainability metrics. And this low level of disclosure gets proportionally lower and lower as company size decreases. In the U.S., performance is generally lower in comparison to the rest of the world. So it's fabulous that the U.S. is now leading the Medals League Table at London 2012 (39 Gold Medals as I write), but sooner or later, even that performance will not be sustainable without stronger and more transparent behavior by American corporations.

There is something about numbers. They clarify our reality. In this review of environmental sustainability and transparency-by-numbers, that reality is rather depressing, because there is a stark realization that, for all the talk, the results are pretty shameful and perhaps, voluntary disclosure is not all it's cracked up to be. Self-regulation is more self than regulation. When the authors of this Sustainability Practices benchmark report maintain that "there is significant room for improvement", I think we can safely agree that this is more than a mild understatement. With Paragraph 47 not promising to be massively instrumental in driving change in transparent disclosure, we have to wonder just what will propel corporations around the world into a different paradigm, before something else propels them out of ostrichland.

An eternal optimist, I believe change will happen. As a realist, I see it's painfully slow. As a pragmatist, I accept that we have to move on and, as the amazing Pema Chodron says, Start Where we Are. As an icecreamist, I know there is always comfort just around the corner.


elaine cohen, CSR consultant, winning (CRRA'12) Sustainability Reporter, HR Professional, Ice Cream Addict. Author of CSR for HR: A necessary partnership for advancing responsible business practices  Contact me via www.twitter.com/elainecohen   on Twitter or via my business website www.b-yond.biz  (Beyond Business Ltd, an inspired CSR consulting and Sustainability Reporting firm)

Friday, July 27, 2012

Sustainability: What the Numbers Tell You

Sustainability is not only about numbers. When all is said and done, sustainability is about people, community, society, collective responsibility and action, stories and interventions. But, sometimes, the numbers form a picture, and pictures can help us develop new insights and change our paradigms. And this can lead to new action. So,  when the The Conference Board, a non-profit organization which creates and disseminates knowledge about management and the marketplace to help executives make the right strategic decisions,  published a deep-dive study - perhaps the most comprehensive study available - of Sustainability Practices of thousands of companies around the world, containing more numbers about Sustainability Practices than I suspect you have ever seen in one place, you have to sit up and take notice. Ready?

The study is called Sustainability Practices 2012 Edition and is a 176 page epic, containing more data than anyone can absorb in one sitting and a wealth of relevant information for anyone interested in sustainability numbers, trends, areas of focus by sector and by subject, and opportunities to make a difference. The report was prepared in collaboration with Bloomberg, who runs one of the most extensive real-time financial and non-financial information networks to hundreds of thousands of subscribers, and with the GRI - no introduction necessary.


Sustainability Practices 2012 Edition is based on a global sample of 3000 business organizations tracked by Bloomberg's Environmental, Social, and Governance (ESG) database and covers 72 environmental and social practices including: atmospheric emissions, water consumption, biodiversity policies, labor standards, human rights practices, and charitable and political contributions. For benchmarking purposes, Bloomberg ESG data is compared with the S&P 500 (large capitalization U.S. companies) and the Russell 1000 (market cap-weighted index of U.S. companies), and further analyzed across 11 business sectors, using the CIGS code, and four revenue groups (under $1 billion, $10 billion, $100 billion and over $100 billion). The findings of the report are split into three broad areas: Disclosure Practices, Environment Practices and Social Practices.

Now for the numbers. Sitting up and taking notice?

19%
This is the overall social and environmental disclosure rate for companies in the global Bloomberg ESG 3000 Index, which is made up of largely non-U.S. companies. Does that surprise you? Only 574 companies out of a total 3,000 disclose on the full spectrum of 72 sustainability practices analyzed. This compares with 15% in the S&P 500 and 10% in the Russell 1000, showing that U.S. companies are lagging when it comes to overall sustainability disclosure. Match this with the next number:

25%
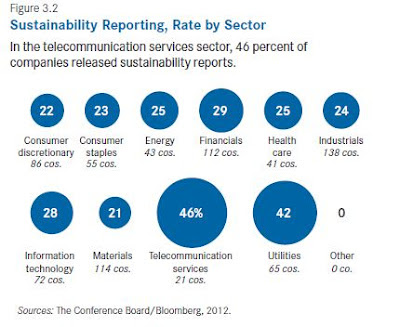
This is the number of companies in the Bloomberg ESG 3000 Index which released Sustainability Reports - 747 companies. More companies are reporting than disclosing. What does that tell us? That Sustainability Reporting is not delivering full transparency. In other words, just because it's called a Sustainability Report doesn't mean that it's transparent. By comparison, in the U.S., 45%  of the S&P 500 and 24% of the Russell 1000 publish reports. However, these indices are smaller and include large-cap, often global, companies, headquartered in the U.S., versus the Bloomberg Index which includes only 510 U.S. companies, 17% of the total 3000 sample. Overall the Bloomberg 3000 is weighted towards Japanese companies who have 27% of the sample, and with strong representation from India, China and the UK, and a host of other countries.  So Sustainability Reporting is more widespread globally than it is in the U.S. But that's not news. Match this with this next number:

80%
This is the rate of Sustainability Reporting for companies with more than $100 billion in annual revenues. Not surprising, perhaps, that this is a high figure. The larger the company, the greater its impacts, the more extensive its resources, the greater its risk exposure, the higher the expectations from stakeholders. However, 20% of these mega-corps are still resisting the reporting opportunity. The rate of Sustainability Reporting drops to 63% for companies over $10 billion, 25% for companies below $10 billion and only 4% for companies below $1 billion. $1 billion is still a heck of a company size and has potential for some serious impact. Who is chasing the other 96%? Match this with this next number:

46%
This is the rate of companies in the telecommunications services sector which publish Sustainability Reports. This is the highest reporting sector in the Bloomberg 3000. Contrary to the long-held view (and data) that financial services companies and energy companies have been leading the fray in sustainability reporting, only 20% and 25% respectively in these two sectors are publishing reports at a global level.


 Great work by telcos. What's driving this industry's reporting prowess? Match that with this number:

48%
This is the rate of telcos which use the GRI guidelines to report. Again, this is the highest rate of all sectors, with an overall average being 30%, generally lower than the hype would suggest. Consumer Discretionary and Information Technology companies have the lowest uptake rate of the GRI guidelines, at 27%.  Again, we find that the highest revenue companies are more likely to use GRI guidelines (66% - 23 companies) versus the lowest revenue companies (10% - 109 companies). The picture in the telecommunications sector is both of high disclosure and high use of the GRI guidelines. Telcos also have the highest rate of report verification and assurance at 26% (versus an overall average of 13%).  Match that with this number:

24%
telcos. No wonder it's so expensive to connect.  But take a look at these numbers:

54% - 43%
The numbers of women employed in the workforce and the numbers of women in management in the telco sector. Hah! One of my favorite indicators.  Not so rosy in the IT sector, where women make up 13% of the workforce and only 9% of management. Across all sectors, the lowest revenue group of companies has the highest proportion of women in management - 24%. Telcos stand out for positive diversity in other respects too - with 26% disabled employees, and 7% of minorities in management. Apparently, if you are a disabled woman from a minority group,  you stand the best chances of advancing your career in a telco. If you are a man, the materials sector is for you. A median 86% of managers are male, and 85% of the total workforce. Match that with this number:

7%
This is the proportion of companies reporting employee fatalities in the Bloomberg 3000. Only 197 companies out of 3000 disclose this figure (even less in the U.S. large company Russell 1000, where only 36 companies disclose). The average rate of fatalities across all those companies reporting is 2, but the Information Technology Sector inflates this average with a total of 6 fatalities. Conclusion: don't go into IT if you value your life. Match that with this number:

59%
This is the proportion of companies that disclose their Health and Safety Policy. This includes 58% of Information Technology companies where six people died. Just think how things might improve if 100% of companies had a Health and Safety Policy. Would things get worse, or better? Match that with this number:

1,367
This is the average number of workforce accidents reported by the 12% (364) companies who disclose this information. I calculate this to be a total of  almost half a million accidents in this small sample. Only 5% of companies report how many lost workhours result from these accidents, reporting an average 56,111 lost hours across only 137 companies, but this is much higher than the average in large U.S. companies, which report an average of 36,121 hours (13 companies) in the Russell 1000. This might indicate that it is safer to work in the U.S.  Or that you have your accident, and get back to work pronto. Even so, the Russell 1000 indicates the lost-time equivalent of 18 employees per year per company that do not come to work as a result of an accident. Rather shocking, don't you think? The impact on families and communities of such safety issues can be quite significant. Match that with this number:

36%
This is the proportion of companies which disclose their charitable giving. I would have expected this number to be higher. Companies like to tell their good news. Match that with this number:

$161,522,597
This is the average community spending reported in the energy sector in the Bloomberg 3000. This is by far the highest rate of charitable giving, comparing with an average across all companies which disclosed of almost $28 million. The healthcare sector is the second largest giver with an average of $98 million reported by 47 companies. Industrial sector companies have not been bitten by the bug to this extent, apparently, with the giving average at a mere $10 million reported by 232 companies. Match that with this number:

$66,800,000
This is the median total corporate giving reported for 21 companies with in the highest revenue group - over $100 billion. If ya got it, share it. Seems to work for them. Companies with under $1 billion revenues give a median of $88,552. Yes, that's thousands, not millions. Match that with this number:

$1,000,353
This is the average utilities sector spend on political lobbying, more than double that of any other sector in this study. Overall, in the Bloomberg 3000, the average amount spent on lobbying is $226,065 per company (though only 14% of companies disclose this information). Interestingly, in the U.S. alone, the amount spent is three times that much. The politicization of business in the U.S. is quite some investment, it seems, if you are a utilities company. Wonder if it's worth it?

I am going to stop here for now, while I continue to study this report. You can read a great review of key findings and  broader conclusions of this report  in the Conference Board's Press Release. Or you can wait for my next post, as I will definitely have more to say about this in the coming week, after getting to the rest of the numbers that I have not looked at yet in detail. 

In the meantime, you might now like a little light relief, by watching the Sustainability Practices 2012 Edition authors, Matteo Tonello, Director of Corporate Leadership at the Conference Board and  Thomas Singer, Conference Board Research Associate, talk about the importance and relevance of this study and what this means. It's short and to the point and contains no numbers.


Thomas Singer rounds off with this perspective: "To a large extent, sustainability is about long-term risk management. It's about making sure that, if you are a company that is dependent on finite resources, you make sure that those resources are available, that they are clean and that you have access to them in the long haul. However there is a very important second part to sustainability which is ensuring innovation and new products, new markets. It is those companies that actually go beyond seeing sustainability as a risk strategy and more of an innovation strategy, those are the companies that really become sustainability leaders in the long term"

Final Tip: ice cream is a great remedy, if your eyes are getting a little fatigued from figures and percentages. Any flavor will do.


elaine cohen, CSR consultant, winning (CRRA'12) Sustainability Reporter, HR Professional, Ice Cream Addict. Author of CSR for HR: A necessary partnership for advancing responsible business practices Contact me via www.twitter.com/elainecohen   on Twitter or via my business website www.b-yond.biz  (Beyond Business Ltd, an inspired CSR consulting and Sustainability Reporting firm)

Saturday, March 3, 2012

Transparency is an asset

Transparency is an asset. That's what we believe here at Beyond Business and at the CSR-Reporting Blog. That's why, back in 2009, we developed the Transparency Index of leading publicly traded companies, analyzing the quality of sustainability transparency on their corporate websites. In 2009, 2010 and 2011, we analyzed the top 100 companies in our home market, Israel. However, the Transparency Index is a globally applicable index, which is equally valid for all companies in all sectors, providing complete comparability on what matters equally as much as what companies are doing to advance their own sustainability and that of the planet: how effectively their corporate websites make this information available and accessible to their local and global stakeholders. Therefore, in 2011, we formed a partnership with the Center for CSR Development in Ukraine, and, after updating the methodology to include some modifications reflecting our experience of performing the analyses over several years, we have started to analyze the leading companies in several additional countries around the globe. We are on our way to developing the first truly Global Transparency Index.

In 2011, we published The Transparency Index for the largest publicly traded companies in South Africa and in the UK. This year, 2012, after slightly modifying the methodology to reflect an improved balance of the Transparency Index four dimensions (reporting, content, navigation, accessibility), we have published a Transparency Index for the largest publicly traded companies in two countries: Denmark and the U.S.

In Denmark, Novo Nordisk takes the trophy with a leading 92% transparency, reflecting top level reporting on sustainability issues and great performance in the other three transparency dimensions on the Novo Nordisk website.  A Twitter stream, with a clearly explained policy, video content and even sustainability games in business ethics, climate change and economics and health. Novo Nordisk is way ahead of the average transparency of the top 25 companies in Denmark which ranks at 57.3%.

Here is how the top ten in Denmark looks:


In the U.S. our findings are that companies are a little more transparent. Average transparency for the top 25 in the U.S. is 69% . Intel takes the trophy here with 91.5% transparency, reflecting sustainability reporting, a highly informative sustainability website, video content, a great  CSR at Intel blog , a report builder and an online feedback form.

Here is the top ten in the U.S.:


The full methodology is transparently (!) described in each report.

While it is true that transparency is only half the picture - it's an important half of the picture. Transparency does not substitute for good performance, but it is necessary as a tool to inform about performance. Transparency is a public statement of commitment to sustainability, encapsulating both a declaration and a promise, a demonstration of serious intent and most importantly, an invitation to stakeholders to read, review and react. As the world embraces digital formats and interactions,  web-based sustainability transparency has an important place in the shaping of sustainability practices.

Watch this space for more countries  to follow in the Global Transparency Index  (and for news of the launch of our new GTI website) and for further analyses as the more countries are added to the mix.


elaine cohen, CSR consultant, Sustainability Reporter, HR Professional, Ice Cream Addict. Author of CSR for HR: A necessary partnership for advancing responsible business practices  Contact me via www.twitter.com/elainecohen   on Twitter or via my business website www.b-yond.biz/en  (Beyond Business, an inspired CSR consulting and Sustainability Reporting firm)

Thursday, September 22, 2011

Transparency is the key to Sustainability

You can't underrate transparency. It is the catalyst for driving sustainability performance. This is why sustainability reporting is so critical. Once a company makes a commitment to transparency, the rest must follow. The commitment to publish carbon emissions, employee turnover, community impacts and more leads a company to ask itself searching questions about its performance. This is why I have made made it my mission to drive awareness of the importance of corporate transparency and spend most of my time involved in activities which are connected with advancing transparency in one way or another. One of these activities is our investment in the development and publication of the Transparency Index which is now becoming a truly global comparative ranking.

We developed the Transparency Index methodology three years ago as a way of assessing the sustainability transparency level of publicly traded corporations via their corporate websites. We tested the methodology for three years in my home-base market, Israel, and have now broadened our scope to include additional countries.

The Transparency Index follows a rigorous methodology which, once determined, leaves almost no scope for judgment - the methodology defines what should sustainability information should be present on a corporation's website, following, broadly, the Global Reporting Initiative reporting framework. This includes information relating to all the sustainability dimensions that would normally be included in sustainability performance reporting. If the information or website feature is present, the company gains points. If it is not, it doesn't. That means that we can be sure of delivering a neutral, unbiased view of corporate transparency as we perform our analyses.  


Transparency Index Scoring Table

Our analysis covers four dimensions: Reporting, Content, Navigation and Accessibility. The Reporting dimension provides half the total points available. An Application Level A report, for example, earns 100 out of a total 200 points. The web-site analysis can then deliver up to an additional 100 points. The final score is an overall transparency percentage. Clearly, we make no judgment about the quality of an organization's sustainability performance - we focus on the quality of its transparency. This is because we believe that transparency is the key to improving sustainability performance. Oops, did I say that already?

Of course, you may take issue with the methodology and believe that points should be allocated with different weightings. You may even believe that the reporting element is overstated. If a company has all of  its sustainability performance on its website, why should it only get half the points? Well, we believe that the process and discipline of working towards a Sustainability Report way outweighs the publication of performance data on a website. A Sustainability Report (of good quality) ensures a comprehensive view of the entire sustainability impacts of a company, reported for one period, in one place, in a structured way. A company which produces a sustainability report and ensures that all sustainability information is easily accessible and navigable on the corporate website (without having to download the sustainability report) achieves optimum transparency in our view. As it stands, I believe The Transparency Index is the only ranking of corporate sustainability-performance website transparency in the world which is completely applicable across sectors, industries and geographies, enabling a true comparison of corporate commitment to transparency.

After having published the Transparency Index for three consecutive years in Israel (2009-2011), covering the top 100 publicly traded companies on the Tel Aviv Stock exchange, we have become expert in analyzing corporate websites and have amassed quite some data about transparency performance. In Israel, leading companies now approach us for details of our analysis of their websites and ask for advice on where to focus in order to improve transparency,  as well as publishing their transparency ranking in their own Sustainability Reports.

You can  download all the three year Israel reports from our website here.

South Africa sets a benchmark

This month we published the Transparency Index of the largest publicly traded companies in South Africa. See the full report here and the Press Release here. 

These large South African companies set a new benchmark in transparency, achieving an average of 78% (versus an average of 48% for the top 25 companies in Israel). The highest ranking was AngloGold Ashanti Ltd with 95% (though the highest ranking in Israel was Bank Hapoalim with 99%).

Ukraine joins the Transparency Index

We have been delighted to welcome the initiative of the dynamic Center for CSR Development in Ukraine to apply the Transparency Index methodology and measure the transparency level of the largest companies in Ukraine.  See the Press Release here. (a full report will follow).

The average level of transparency of the top 106 companies in Ukraine was 21% (35% for the top 100 in Israel), demonstrating that there is much work to do in both countries. DTEK, a large Ukraine energy company, achieved the highest ranking in Ukraine at 80% sustainability transparency.

Transparency Index Global Comparison

In addition to our work in Israel and South Africa, our friends in Ukraine performed a comparative analysis of thirty additional companies - ten from Russia and twenty leading global corporations.

Using the Ukraine analysis and our own analyses, we can come up with a semi-global league table which presents the top 20 companies out of the 260 + company sites analyzed:


In this top 20 so far, we have 9 South African companies, 5 global companies, 4 from Israel and one from Russia and one from Ukraine. The overall average of these leading companies for Sustainability Transparency is 88%, a very respectable benchmark for other companies to aspire to.

In the coming months, we will be adding UK, USA, Canada, India and other countries. As we grow our global transparency database, we will perform industry and sector analyses, as well as analyses relating to the sustainability content which is most widely published on websites and that which is not. At present, this information is only provided in country level reports.

Transparency is key to sustainability. Watch as the Transparency Index grows in scope and use it to influence companies toward greater transparency.


elaine cohen, CSR consultant, Sustainability Reporter, HR Professional, Ice Cream Addict. Author of CSR for HR: A necessary partnership for advancing responsible business practices Contact me via www.twitter.com/elainecohen  on Twitter or via my business website www.b-yond.biz/en  (BeyondBusiness, an inspired CSR consulting and Sustainability Reporting firm)

Sunday, May 29, 2011

The Third Israel Sustainabilty Transparency Index 2011

You cannot have sustainability without transparency. It's like chunky and monkey. Or lap and top. Or CSR and HR. Or air and conditioner. Or foot and print. Transparency is both a window to a company's sustainability performance and impacts and also a driver of those performance and impacts. Companies who believe they can "do the right thing" and not tell anyone about it are in a Middle Ages mindset and will not be able to compete effectively over time in the current business climate. Transparency brings tremendous opportunities to engage with stakeholders in dialog which can support the identification of new business opportunities and mitigate risk. Am I preaching ? Perhaps. But in my home market, Israel, this is apparently what is needed, because for the third year in a row, Israeli companies FAIL at transparency. My company, Beyond Business, established the Israeli Transparency Index three years ago, with the objective of monitoring the level of transparency of the top 100 publicly traded companies on the Tel Aviv Stock Exchange. Back then, in 2009, the average transparency level of these top 100 companies, with a collective market capitalization of over $150 billion, was 31%. A year later, it was 33%. And now, in 2011, it is 35%. That's pretty dismal for a supposedly advanced market such as ours. Download the full report here.

There are some leading lights. The top three companies who have raised the Index for the past three years are:

Bank Hapoalim (with a hat trick of first place, achieving 99% transparency in 2011)
Bank Leumi (achieving 95% transparency in 2011)
Strauss Group (achieving 88% transparency in 2011)

The Top Ten are shown below.


Only these 10 companies (10%) achieve transparency levels of over 50%, and eight companies (8%) have no transparency AT ALL, as they have no website and produce no sustainability reports.


By design, our Transparency Index rewards the presence of a Sustainability Report which we believe to be one of the leading tools for establishing both transparency processes in the business and required transparency to external stakeholders. Of the full 200 points available for Transparency in the Index analysis methodology, a high transparency report such as one meeting the Global Reporting Initiative Application level A earns 100 points, whereas an Application level B report earns 80 points. Lower transparency reports, whether written according to the GRI framework or otherwise, earn lower points according to the level of transparency of their content. Therefore, it is no surprise that higher scores for transparency are significantly influenced by the presence of a Sustainability Report on the Company website, or similar transparent communication such as a Communication on Progress to the United Nations Global Compact, or an extensive CSR disclosure in an Annual Report. This is because we believe that reporting adds a rigor to transparency that is not present in general website disclosures. Consequently, Companies who lead in the Transparency Index are generally those who published Sustainability or Corporate Responsibility reports.

In the 2011 Index, a total of 14 companies reported in one form or another, up from 12 in 2010 and 5 in 2009. 2011 figures include three companies which achieved full points for a Sustainability Report at GRI level A, four Companies which received partial points for a Sustainability Report at GRI level B, and 7 Companies which received partial points for lower level transparency reports.

The Index methodology scores 4 dimensions: reporting, content, navigation and accessibility. The methodology requires no interpretation or personal judgment and the full scoring for each of the 22 data points is fully transparent (would you expect any less of a transparency index?). We devised this methodology in this way specifically to avoid issues of objectivity. If it's there, you get points. If not, you don't.   

It was encouraging this year, after we had announced that we would be analyzing websites during the month of March 2011, that several companies called us up to ask what they need to do to improve their transparency levels. Slowly but surely, we may be seeing transparency moving into corporate awareness as another dimension of competitive market conditions in the new sustainable era.
As we do each year, we awarded the Top Ten Transparent companies with a certificate at our annual Sustainability Reporting Conference.


In the meantime, here's hoping that the Israel Transparency Results for 2012 will show some improvement. Does no harm to be optimistic, right?


elaine cohen, CSR consultant, Sustainabilty Reporter, HR Professional, Ice Cream Addict. Author of CSR for HR: A necessary partnership for advancing responsible business practices . Contact me via www.twitter.com/elainecohen  on Twitter or via my business website www.b-yond.biz/en  (BeyondBusiness, an inspired CSR consulting and Sustainability Reporting firm)

Friday, November 19, 2010

The New CSR Social Media Index. Essential Reading

The big news this week is the publication of the Social Media Sustainability Index. It has a short subtitle: "An essential guide to how the world's most sustainable companies are communicating their green convictions and deeds through social media". Haha. Real short, right ? But this new Index  is a delight. It's well researched, well written and quite illuminating. I love it! (I don't usually go overboard with the superlatives, being a British-born restrained sort of type, but I really do like this index which combines two of my favourite worlds - CSR and Social Media). Let's dive in:

Commissioned by SMI,  and authored by Matthew Yeomans of Custom Communications, an experienced business and environmental journalist, the report provides an overview of "The changing world of sustainability communications", a useful series of tips on the Do's and Don'ts of CSR in Social Media for optimum reputation management and  a list of Green Twitterati from the media, consultants (including yours truly and most of my other faves), companies, NGO's and academia/politics. This is a #FollowFriday list if ever I have seen one. The report continues with an overview of Sustainability Social Media elements such as online publishing of sustainability information, campaigns and reporting, showing how companies are currently leveraging these channels. Then comes a list of 15 companies "to watch", those who demonstrate best Sust-Soc-Med practices. AMD, Allianz and Dell are at the top of the list. This concludes the report narrative. The remainder of the report is the result of a detailed analysis of the way companies are using SocMed, providing a matrix showing each comany's Sust-Soc-Med activity, sector by sector. There are 10 sectors (sector leaders in brackets) :
  1. Basic Materials (Alcoa)
  2. Consumer Goods (Ford)
  3. Consumer Services (Starbucks)
  4. Financials (BBVA)
  5. Healthcare (Novartis)
  6. Industrials (GE)
  7. Oil&Gas (ENI)
  8. Technology (IBM)
  9. Telecoms (Telefonica)
  10. Uilities (PG&E)

As with any index of this nature, what is of most interest, serving to establish credibility, is the methodoloy used to perform the analysis. Here the Sust-Doc-Med-Index is quite clear: each company (using the North America and Europe DJSI list of 287 companies) has the possibility of scoring up to 100. Marks were given for how actively companies were in using social media for sustainability, how creative they were and how accessible their stuff is. This is how it goes:

If companies had a social media channel - blog, twitter account, YouTube channel - devoted to CSR then they got 40 points. (This is a "dedicated" social media channel)

If companies used a general corporate social media channel to sometimes discuss CSR then they got 30 points.

THEN....

If companies were also running a social media campaign dedicated to a CSR cause (for example,  Pepsi Refresh ) then they got another 20 points.

If companies were opening up their social media channel to comments and conversation then they got 10 points.

If companies were making their Sustainability Report accessible using social media they got 10 points.

Finally, companies were ranked on how creative they were in conveying sustainability through social media (storytelling, creative ideas) with a score of 1 - 20. This is the only part of the methodology which requires an assessment and a differentiated  rather than an absolute score for the elements described above. Getting a full 100 points therefore is possible only if companies are really really creative, as judged by the analyst. This is a clear, logical methodology which makes for good credibility of the ranking results. No companies scored a full 100, but a few came very close with GE, Starbucks, IBM, Ford and Dell all earning 95 points or more.

A few quick facts from the analysis:

85% of companies use social media as some part of their communications or PR portfolio.

All 3 companies in the Telecommunications sector and 10 out of 13 companies in the Technology sector have blogs, but NONE of the companies in the Basic Materials, Health Care or Oil and Gas sectors have blogs.

The vast majority of Consumer Goods companies have Twitter accounts,  Facebook pages and You Tube channels.

Technology was by far the most engaging sector for the author of this report. He found that the US tech companies all have dedicated social media sustainability communication channels. Only 4 companies out of the 25 surveyed in the Oil and Gas sector use Social Media.

5 of the top 10 scoring companies are in the consumer facing sectors: Ford, Starbucks, Puma, Pepsico and Svenska Cellulosa. err wait. Svenska Cellulosa ? Had to take a look at that. Here is their website. The first things that stands out on their sustainability section is a survey ...but when I clicked on "Take the survey" I ended up in a Google Docs page with no survey. However, despite the fact that this company doesn't blog or tweet, they do do Facebook and YouTube.

Nestle would have scored higher were it not for their now infamous Facebook blunder, which lost them 40 points. If they had been a little more prudent, they might have just nudge into the top 20.


Matthew Yeomans  told me about Sust-Soc-Med:
Companies that make best use of social media for CSR communications understand that online communities care about sustainability and, as companies, they are interested in the input of all their stakeholders. What's more, they understand that social media allows the smart companies to show how they can be useful to society, allowing them to walk the walk rather than just talking about how sustainable they are.

But be warned, says the report, "social media communities are notoriously quick to spot fakery and dismantle corporate spin. The companies that try to hoodwink the public or inflate their claims of sustainability using social media will be found out very quickly".

To round off, CSR and Social Media need to be on the same page. As a route to engagement, dialogue and  building reputation, the power of Social Media is huge. Companies who think this through well, and execute well, will gain immeasurable benefits. Perhaps many companies shy away from the Soc-Med thing because of the potential risks. I think the balance has now changed and the potential risks are greater by not engaging in social media.

The Sustainability Social Media Index will be updated annually. A full 12 months for all the laggard companies to check out their ranking and get blogging. Looking foward to seeing the changes next time around, oh, and to reading the plethora of corporate blogs that are likely to appear in 2011. And as I write, I just got followed by @ecomagination. How did they know I was writing this piece?


elaine cohen, CSR consultant, Sustainabilty Reporter, HR Professional, Ice Cream Addict. Author of CSR for HR: A necessary partnership for advancing responsible business practices  Contact me via www.twitter.com/elainecohen  on Twitter or via my business website www.b-yond.biz/en  (BeyondBusiness, CSR consulting and Sustainability Reporting firm)
Related Posts with Thumbnails