Showing posts with label social and environmental impacts. Show all posts

Friday, November 25, 2016

The missing piece of the materiality puzzle

Earlier this year, I had quite a lot of fun as a GRI-appointed Quality Control Officer, whose role is to attend GRI training courses as an observer and report back to GRI if certified GRI training is being conducted professionally, competently and in line with GRI standards. This is fascinating for me, mainly because it's so interesting to hear what training delegates ask about and comment on during the course. In one session, a delegate asked the ultimate G4 (now GRI Standards) question - the very same one that I asked GRI Standards leading architect Bastian Buck of GRI, three years back:

Is it OK to write a G4 report with just one material issue? 

The answer of course is Yes and No.

Yes, because technically, if you have determined that your organization has only one material impact, then disclosing this and using GRI to report it does actually tick the box.

No, because, I believe, no organization can be so simple that its impact is entirely mono-dimensional. Even micro-businesses operate across more than one dimension. No business has just one stakeholder.

Behind this ultimate question, then, is the deeper consideration of how organizations define their most material impacts for the purpose of strategy development and reporting. It's not so much about whether you can ride the framework with one material issue; it's about the value you derive from understanding what's material for your business. 

Materiality and Strategy 
One of the positive developments following the introduction of G4 was the elevation of materiality from dormant to active in the minds of companies and reporters. Transitioning to G4 has generally appeared to cause companies to engage in some level of thinking about what's material and how to define it. In some cases, this has been a meaningful exercise where materiality is the result of insightful stakeholder dialogue and the precursor to a multi-year sustainability strategy and basis for reporting. In other cases, we are still seeing the disconnect - where companies have, on the one hand, a sustainability strategy and, on the other hand, a list of material issues that bears no resemblance to the strategy and a report which covers everything except what is deemed material. The next stage in materiality maturity is helping companies to see that this all plays out on the same playground. Sustainability strategy has to be the result of materiality analysis. Materiality can never be in a vacuum.

Materiality and Impacts
Which brings me to another interesting and highly geeky thing I did this week. I listened in on the GRI Global Sustainability Standards Board (GSSB) meeting (for the second time). It's fascinating to be a fly on the wall as the GSSB debates the different aspects of developing GRI Standards. I have to commend GRI and GSSB on full transparency here - all the meeting documents are available and the meeting itself is audio live-streamed (shame about the video!) - and it's a truly illuminating discussion... if you are a reporting geek like me.

One of the topics that came up this time around was the definition of materiality and the clarification of this in the new GRI Standards. GRI maintains that to date, people have "misinterpreted" the definition of materiality, and that the new terminology in GRI Standards makes this much clearer. GRI Standards 100:1.3 states: "Relevant topics, which potentially merit inclusion in the report, are those that can reasonably be considered important for reflecting the organization’s economic, environmental, and social impacts, or influencing the decisions of stakeholders. In this context, ‘impact’ refers to the effect an organization has on the economy, the environment, and/or society (positive or negative)."


In G4, material impacts were defined as follows:
In the GRI 100 Glossary of the GRI Standards, it is now clarified as follows:
A Sustainability Report should therefore report impacts OF the business and ON the decisions of stakeholders. It is not about the impacts of sustainability on the business. The guidance matrix in the GRI Standards remains the same in the GRI Standards is it was in G4 (though the colors have changed a little 😌) (NB: I remind you that a matrix is NOT necessary for GRI Reporting - a list of priority issues is perfectly adequate.)

This the application of this matrix - or specifically, the focus of each of the axes -  has commonly been misused in G4 reporting.

3M's 2016 Sustainability Report, for example, uses reputation on the Y axis and stakeholders on the X axis:

The Fedex 2016 Global Citizenship Report uses stakeholders and business success:


Both these approaches do not reflect the actual intention of the GRI framework. The GRI approach is designed to create a report that reflects impacts on the economy, people and planet. The shape and size of the impact of your specific business is key to defining your positive (or negative) contribution to society. The primary focus in sustainability reporting should be the size and nature of the impacts OF your business and how your business affects our lives. In the GRI Standards, that should now be crystal clear. The outcomes of the way your business addresses mitigating negative impacts or enhancing positive impacts is reflected in your reputation, business success and value creation.

In the conversation at the GSSB, where I was a fly, a concern was raised that some companies have spent fortunes on materiality assessments that include this measure of "importance to business success". "What should they do now?", was the question. Well, it's not the end of the world. There is some overlap. Quite often, these issues will naturally coincide. Almost always, in fact. But in the next review of material impacts, there's an opportunity to better align with the letter and spirit of the reporting standard (and stakeholder expectations).

Which brings me to the more important question: How do you prioritize material impacts?

Materiality and Prioritization
The big weakness in the GRI Standards is the lack of robust guidance for defining the process for prioritizing material impacts. GRI could have been prescriptive in this area. The GRI Standards omit the guidance that was contained in G4 around the stages of defining material impacts: identification, prioritization, validation and review. However, even that guidance did not prescribe a robust process for getting from the universe of many impacts to the fewer most material impacts.  Few companies, if any, actually report this process in a way that help us understand the voices that counted in prioritizing specific impacts.

It's easy enough to define the landscape of relevant issues. But the prioritization has often been reduced to a number-crunching exercise, where different groups give scores to different topics, the numbers are added up and voila - you have a matrix. The outcome of this process can vary widely depending on which voices you count, what weight you give to each voice, how each voice assesses the value of each impact and the weighting factors you use to roll that up into one coherent list of issues. These details are rarely disclosed by companies. The entire basis upon which material impact reporting rests is therefore not transparent and possibly, not robust.

Lloyds Bank publishes a Materiality Report.


The bank describes its process for defining material impacts:

This looks like an invested process. A universe of 50 issues was established. Representatives of six stakeholder groups (including employees as one group) took part in an online survey to rank the issues in order of importance. The online input was supplemented by the opinions of Lloyds external Stakeholder Advisory Group who provided "proxy representation on behalf of some of these groups". The responses were weighted according to "stakeholder group sample and data quality with priority given to direct feedback and Stakeholder Advisory Panel feedback". Then it was all rolled up into a set of 14 issues in 5 categories that appear to have equal priority as the most material impacts.


The issues look to be a reasonable mix of what we might expect a large banking group to prioritize at a general level. But they could also be the issues of any bank anywhere in any country. Trust in business, job creation, access to products and services, customer satisfaction - this tells me nothing about Lloyds Banking Group that is specific to that company. This begs the questions: How detailed was the initial universe of material issues? How was the weighting of stakeholder responses constructed?

Another bank, for example, presents a more company-sector specific picture. Westpac Australia's materiality matrix includes impacts such as positive impact finance, financial capability and empowerment, digital product and service transformation (an issue which is sweeping the banking industry worldwide for obvious reasons) and macroeconomic and demographic trends that are current in the materiality assessment period.

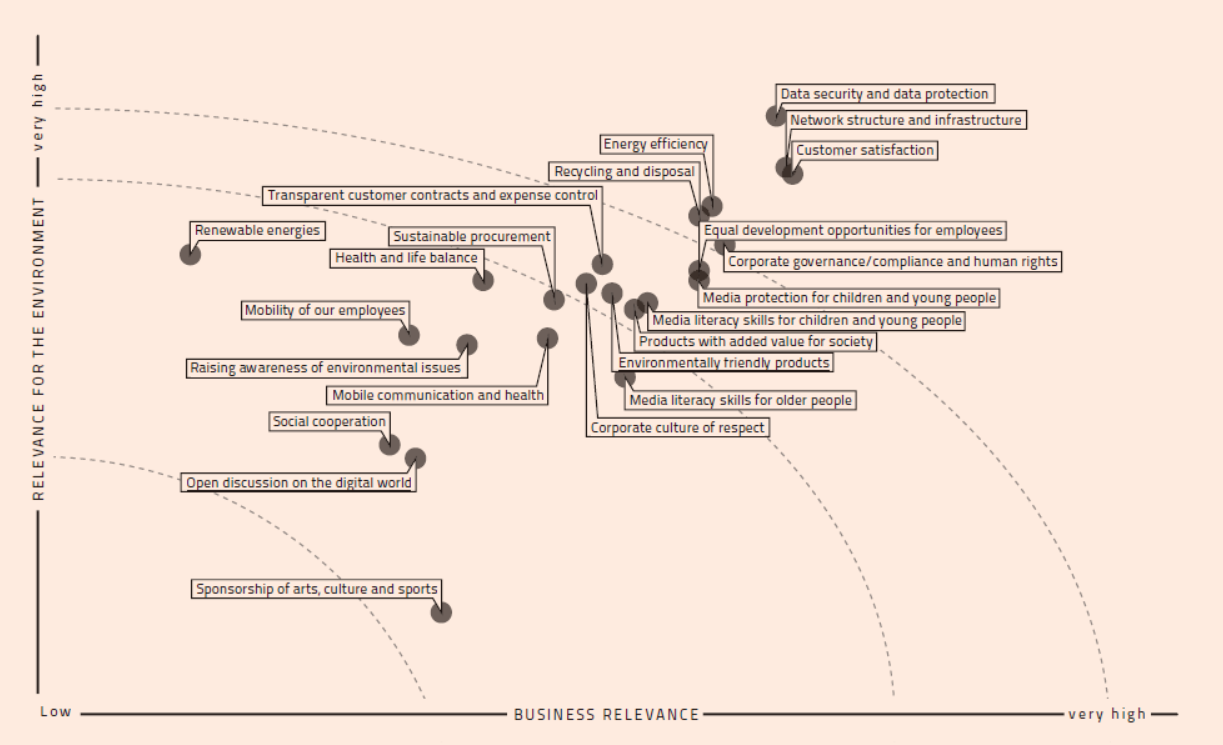
Westpac's matrix refers to impacts that are important to stakeholder and important to the business, but, despite this bank's detailed disclosure of stakeholder issues and responses, we are still left in the dark about the process used to assign prioritization to these top 18 material impacts. What influenced the positioning of the dots on this matrix? How were the different stakeholder inputs evaluated?

Next week, I will be presenting the findings of an analysis I performed on behalf of BSI, the UK's national standards body, of sustainability performance and reporting standards that are used predominantly today. The presentation will serve as a basis for dialogue at an event hosted by BSI to consider where standardization or additional focused guidance may assist companies in advancing sustainability performance and reporting. 

If materiality is central to reporting, does the process of defining materiality not merit greater structure and transparency? Good process, good outcome. But what is the process for determining materiality? Every company uses its own logic to develop a process that delivers a result. But if the process is flawed, then the result is flawed. How can we know that companies are reporting the most material issues? If the process is different in every case, the outcomes are not comparable. One of the recommendations I am tabling for discussion next week is that there should be robust process standards for the determination of material impacts. What do you think? I'd welcome your thoughts as we consider this fundamental question that goes to the heart of relevant corporate transparency. The actual event is fully booked with a long waiting list, so if you have a strong view, write to me here or comment on this blog. I am very interested to hear your views.

In the meantime, the good news is that companies are making efforts to define material impacts. Even an imperfect, undisclosed process is a start. As I often say, 80% of something is better than 100% of nothing.
 

elaine cohen, CSR consultant, Sustainability Reporter, HR Professional, Ice Cream Addict. Author of Understanding G4: the Concise Guide to Next Generation Sustainability Reporting  AND  Sustainability Reporting for SMEs: Competitive Advantage Through Transparency AND CSR for HR: A necessary partnership for advancing responsible business practices . Contact me via Twitter (@elainecohen)  or via my business website www.b-yond.biz   (Beyond Business Ltd, an inspired CSR consulting and Sustainability Reporting firm).  Need help writing your first / next Sustainability Report? Contact elaine: info@b-yond.biz   

Sunday, December 28, 2014

Why the materiality matrix is useless

2015 is a new year - Happy New Year to everyone! And as we close out 2014, I thought it would be a good time to shake things up a little and get just a touch provocative. (Totally out of character, haha). See, I have begun to be really irritated by useless materiality matrices.  I am looking forward to a year in 2015 where materiality drives strategy and reporting in a profound way, and where we stop playing around with dots on a matrix just because that's what seems to be the de rigeur of sustainability reporting.

One of the things that is going to have to get a whole lot better if companies are really going to gain best value from a strategic sustainability approach is the way materiality is considered, analyzed, developed and communicated, as well as, more importantly, used as a basis to drive action. In many cases, it's near impossible to relate what are stated as material issues to the way the company approaches its sustainability activities. The more G4 reports I read, the more materiality matrices I look at,  the more I come to the conclusion that, by and large, many companies are just missing the point

This is probably not entirely intentional. Maybe many companies actually think they are doing a good job of defining materiality. Spending time plotting little dots on a matrix and moving them up or down a millimeter may actually be someone's idea of meaningful strategic planning. Maybe people think that's how it's supposed to be done. Maybe companies look at their materiality matrices and give themselves a big slap on the back. 

But actually, it's not being done well. It's not hitting the right spots. It's not generating the leverage that is needed. Materiality, so far, as a concept, is not proving itself. It's a nice buzz word, makes everyone feel good, sound intelligent and provides creative license to draw pleasant graphs, charts and multicolor, even interactive, visuals, but it's not doing what it intended to do. This is clear from the disconnect we are still finding in sustainability reports between what's supposedly material (because the matrix says so) and what companies are actually doing (based on what's reported). 

The basis for my comments is my personal review of many of the 500+ GRI G4-based sustainability reports that have been published to date. I am referring to G4, because G4 places material impacts squarely at the center of the reporting approach. Not because it's right for reporting. Because it's right for business. This is how GRI G4 defines materiality: 


In G4 reporting, companies are required to list material aspects and provide disclosures that show how  an organization "identifies, analyzes, and responds to its actual and potential material economic, environmental and social impacts". Performance indicators supporting  material aspects are designed to reflect how a company measures its performance in relation to those stated material impacts. While I know that the G4 framework is not always 100% logical, and there is, in many cases, a rather unfathomable connection between certain material Aspects in the framework and the Performance Indicators that are designed to reflect those Aspects, the underlying issue is whether companies are approaching materiality in a meaningful way. (Perhaps someone might even be able to explain to me why G4 chose the very odd word Aspects and did not use the very clear word Impacts when making materiality the G4 engine driver). The metrics, or indicators, can be adapted or developed to meet the need. The material impacts should first drive what a company does or should do, and therefore measures, and therefore reports. Creating a materiality matrix after you have done everything else is not exactly going about things in the right way.

Let's think about what materiality really means in a sustainability context. It means the material impacts IMPACTS IMPACTS on stakeholders. 

These are things that material impacts are NOT (or not only):
  • what's going to help us make more profit
  • what our stakeholders mention in passing
  • how we perform
  • what we think is politically correct
  • what everybody else is saying
  • what's easiest to report
  • what shows us up best
  • what's in fashion
  • what the  lawyers tell us to say
  • what we've always said
  • what the assurers can count
  • things we have data for
  • an afterthought
  • an easy option
  • a buzz word
  • a box to tick
  • lip-service
  • a way to appear as though we wrote a G4 Sustainability Report

Material impacts are: 
  • the way our business activities affect the lives of our stakeholders and our long-term business viability
  • the basis for creating a sustainable business strategy with relevant targets
  • defined as the result of an analytical process that engages internal and external stakeholders about what affects them and how
  • the basis for creating sustainability communications including reporting
  • specific to a business, a sector, a geography, an issue
  • a catalyst for planning and action
  • connected to a business's core social mission
A few examples? Sure. Wizness recently published a free download benchmark of 50 materiality matrices across 5 industry sectors. Almost all of them have loads of little dots carefully plotted on creatively designed squares, blocks and circles. Some of them have so many dots you begin to wonder how on earth the company even recognizes the dots, let alone creates a strategy to manage them. Whoever is selling dots is making a killing. And the relativity between the dots is often just incomprehensible. Here are some examples from the ones presented by Wizness:

You may be able to see, just about, that this company has loads and loads of dots, with the top 16 prioritized as the most material issues/impacts, supported by a detailed stakeholder matrix of what affects whom. The top 9 issues all have the same degree of importance to stakeholders, yet they are all at different coordinates on the matrix. Compliance with laws and regulations is only mediumly important to the business and to stakeholders while compliance with laws concerning products and services hits the top right box in the matrix. I wonder how these nine issues were plotted. What makes anti-corruption so much more important than anti-competitive behavior? The report gives no clue to how these issues were placed in the matrix. Their placement suggests that they are not equally most material and that some are more most material than others. What does this differentiation actually mean? To me, it suggests that there is a focus on moving dots around a matrix and not on the underlying drivers of sustainability performance. Notwithstanding the fact that the very act of defining a set of material priorities is an important part of the process and should be encouraged.  

Here is another example:

Pan American Silver Sustainability Report 2013


Wow. The entire 46 G4 material Aspects and Sector Disclosure Aspects all carefully ticked or unticked and slotted into place on a matrix that it took me half an hour to work out what's where. I wonder how long the plotting exercise took and how the little letters on the matrix were locked into position. The color coding of the different categories makes it almost impossible to tell without detailed study what is actually most material for this company. It looks to me like the top three - turquoise "a" is "local communities" as the top issue,  purple "c" is "occupational health and safety" one of the two runners-up and blue "d" looks like child labor as the second runner up. Why are these issues more important, than, say, anti-corruption, which appears much lower on the list, or labor relations which is not material at all?

In Pan Silver's report, there is a large section devoted to the most material Aspect, local communities. It's about how Pan Silver, while doing its core business, is engaged with local community projects to support economic and social development. A really fine array of projects that I am sure are highly commendable and make a genuine difference to local quality of life. But why is engaging with local community development projects the most material impact of this company? What about the impacts generated through the company's core business? What about materials use and ecological limits? Pan Silver produced 26 million ounces of silver and 150 thousand ounces of gold in 2013. What about water use in the mining sector? Total water withdrawn for Pan Silver in 2013 was more than 42 million cubic meters, that's about 15,000 Olympic swimming pools. Not to mention water discharge with potential toxic chemicals. Pan Silver has addressed these issues in the report, but what makes them less important local community projects? Does the materiality matrix indicate priority in allocation of the company's resources required to address material impacts, suggesting that a higher priority received more attention, more resources, more commitment? What I would really like to know from Pan Silver is its most significant impacts on stakeholders. The top 5 or 10. I don't really care where they are on a matrix. I don't really care about the tenth of a millimeter of space between the little letters. Does anyone? I don't even believe it is possible to differentiate between the most important material impacts at this level of detail. I am sure the process of thinking about what is most important should have been beneficial. I suspect that the part where the dots on the matrix slotted into place is simply a total waste of time.  

And here is another example from The Hershey Company 2013 CSR Report.


Hershey's has defined the priority issues and they are all dealt with well in the company's CSR report. It's great that out of a total of 25 issues, Hershey has selected ten that represent the most important impacts. However, what makes food safety so much less important than ethical sourcing? Why is child labor so much more important than GHG emissions? Why is ethics more important than governance? And if philanthropy is so low on the matrix, both for stakeholders and for the company, then what's it even doing on the matrix? Isn't that just a waste of energy, deciding where to put the philanthropy dot? And if the currency is dots, is philanthropy the only dot that is loooooooow priority? I could think of a whole load of additional issues that might have come up in a materiality discussion that are not on this matrix. The point is, selection of the top ten prioirities is great. Using these materiality priorities to define strategy is fantastic, and structuring your reporting around these material priorities is brilliant. Hershey does this fairly well.


But taking that to the point of plotting dots on a useless matrix is what I don't understand. Especially if no-one explains why these dots are where they are.

The GRI G4 guidelines does not require the presentation of material Aspects in a matrix. The reporting disclosure is:
The G4 guidance for determining what is material makes reference to defining thresholds for materiality and defining and documenting how the thresholds have been defined. The guidance also offers a matrix for presentation of material issues. But this is guidance... it's not a G4 requirement. In general, the companies that present materiality matrices define why issues are material but they do not make reference to the relative material priority of each dot on the matrix. So why bother with a matrix. Why not simply do what is asked: give a list.

Materiality and its importance were recently addressed by think-tank advisory firm SustainAbility


SustainAbility published an excellent paper on transparency and its use as a driver for improved performance. SustainAbility says: "Most companies are not gaining the value commensurate with the resources spent on reporting." This is a proposition that I wholly agree with, for many reasons. (Haha - you can see that from my red text). SustainAbility's response to this is to use materiality to drive the rest. 


The SustainAbility paper provides two examples of materiality presented in reports: PG&E and Fibria. 

The PG&E Sustainability Report for 2013 presents a materiality matrix in a pretty familiar way - using dots. (SustainAbility helped PG&E create this matrix.) It has an element not usually found in materiality matrices: the addition of arrows showing the interrelation of issues. The online presentation of the matrix is interactive - when you click on an issue, it turns blue and a number of little orange dots show up connecting things to the blue dot, as in the version shown below. No connection between Public Safety and Employee Engagement, for example. Seems rather odd to me. However, SustainAbility writes in their report that highlighting interconnectivity between issues "provided insight into how PG&E might approach issues in a more integrated way." Intuitively, that sounds sensible to me. Although, if I were to be truly provocative, I would say that pretty much everything is connected to pretty much everything.   


In the PG&E matrix, however, we again we have a nicely arranged set of dots. It is not clear, based on the description of the process, what criteria were used to actually decide where each dot should be carefully placed. On what basis do you assess the scale of business impact? Is this an opinion based assessment or a fact-based analysis? Interestingly, PG&E states that: "PG&E’s materiality assessment identified 18 issues. Every issue is material to PG&E’s long-term sustainability, regardless of its placement on the matrix." Sounds to me that there is no need for a matrix. The real value of the process was the engagement benefit. See this quote from the Corporate Sustainability Director.


The Fibria 2013 Sustainability Report, on the other hand, uses the list method. Isn't this super-clear? Ten key issues, all equally important, all top priority. Businesses are complex things. It's OK to have more than one top priority. 


For those of you who like a little more detail and to know where things fit, Fibria provides an infographic: 

However, the plain, no-dots list of material issues, and its use in defining strategy and reporting is.... for me.. the way to go. I like the list. I don't like the meaningless matrix.

In addition to the list of top priorities, for completeness, companies may also select to indicate other topics that are on the radar, but not considered to be most material. This could be another (not too long) list. All attempts at creating flurries of dots is simply a waste of energy.

So here's to a great 2015 and clear, focused, material reporting.
Down with the matrix.
Up with the list. 


elaine cohen, CSR consultant, Sustainability Reporter, HR Professional, Ice Cream Addict. Author of Understanding G4: the Concise guide to Next Generation Sustainability Reporting  AND  Sustainability Reporting for SMEs: Competitive Advantage Through Transparency AND CSR for HR: A necessary partnership for advancing responsible business practices . Contact me via Twitter (@elainecohen)  or via my business website www.b-yond.biz   (Beyond Business Ltd, an inspired CSR consulting and Sustainability Reporting firm).  Need help writing YOUR Top Ten Report in 2015? Contact Elaine: info@b-yond.biz   

Wednesday, November 12, 2014

Is EP&L a waste of time?

As promised (threatened?), another post about the work of the WBCSD and my involvement in the Council meetings in Atlanta last week.

I was greatly privileged to moderate a plenary panel session on the subject of "Redefining Value - costing externalities" with three incredible sustainability and business achievers.


Marie-Claire Daveu: Chief Sustainability Officer and Head of International Institutional Affairs of Kering and member of Kering Executive Committee.   

After embarking on a career as a senior civil servant in the field of agriculture and the environment, Marie-Claire Daveu served as Technical Adviser to the Cabinet of Prime minister Jean-Pierre Raffarin, the Principal Private Secretary to Serge Lepeltier, Minister of Ecology and Sustainable Development, before joining Sanofi-Aventis Group in 2005 as Head of Sustainable Development. From 2007 to 2012, Marie-Claire Daveu served as Principal Private Secretary to Nathalie Kosciusko-Morizet, first within the Ministry of Ecology, then in charge of forecasting and the digital economy, and lastly, within the Ministry of Ecology, Sustainable Development, Transport and Housing. Since 2012, Marie-Claire heads up sustainability at Kering. Kering is a Group of 22 Luxury and Sport & Lifestyle brands such as Gucci, Bottega Veneta, Saint Laurent, Alexander McQueen, Stella McCartney, PUMA and others.  


Roberto Salas: CEO of Masisa, Chile

Roberto Salas serves as President of Grupo Nueva and, since 2008, in addition, as CEO at Masisa, one of the Latin American leaders in production and marketing of wood fiber boards for furniture and interior decorations headquartered in Santiago, Chile. Roberto began his career in Grupo Nueva in 1989, Ecuador. Roberto is Co-Chair of the Development Area of World Business Council for Sustainable Development. He was a Professor at the Faculty of Economics, Universidad Católica de Guayaquil, for 17 years.


Roberto Pedote: Chief Financial and Investor Relations Officer, Natura, Brazil

Roberto Pedote is responsible for Natura's financial and legal matters, as well as investor relations and corporate affairs. Formerly, he spent 16 years with Unilever in Brazil, England and Latin America, and served as Finance Vice-President for the Food and Ice Cream Division in Brazil. Prior to this he served as  Finance and Control Director for Nokia of Brazil. Since 2010, Roberto has been a member of the International Integrated Reporting Council (IIRC), and in 2013 he was appointed member of the Advisory Board for BM&FBOVESPA Listing. Natura is a Brazilian manufacturer and marketer of beauty products, household, and personal care, skin care, solar filters, cosmetics, perfume and hair care products. 

This was a rare occasion to have a CEO, a CSO and a CFO of major corporations together on a stage and ready to share insights about a rather controversial aspect of sustainability accounting and disclosure. I opened up with a really easy question!

"When we talk about externalities, we refer to all those often invisible impacts on society of doing business – the indirect social and environmental effects of your activities on climate change, health and the quality of life. Does it make sense to suggest that companies should calculate and account for these costs? Or is this just a diversion designed to help companies avoid doing the hard work of changing how they business in a more sustainable way?"

All three panelists responded in different ways, referring to the value of the externality costing approach, particularly as a tool to help resource allocation, prioritization and decision-making withing the company. By bringing impacts to a common denominator language in money terms - monetizing impacts - organizations have a new tool to identify and quantify the ways their business activities show up throughout the entire value chain. By using a common language, impacts can be prioritized more easily. Not only this, the exercise forces debate. It presences aspects of business impacts that have previously never been considered. Just having a conversation about externalities in your organization is an interesting first step, and the process of evaluating them, even moreso. Through debates such as these, leading edge companies are now starting to change the game. In our favor. 

To remind you, Kering was, I believe, the first organization to publish in what was thought to be a very bold move, the Environmental Profit and Loss statement of one of its companies, PUMA, back in 2011. (See a great infographic about the value of the EP&L on the Kering website) Marie-Claire Daveu promised that the EP&L for the entire Kering Group would be published soon. The EP&L now can be used to compare and reprioritize impact and risk management across the entire Kering group of companies, using the same tool.

The EP&L created quite a  stir in its day with many hailing it as the new way forward for corporate disclosure. Although many were impressed, there were also many questions. Is it reliable? Does it make sense to put a price on the environment? Is it accurate? Does monetization devalue the true impacts of business? Like, can you put a price on caring? 

We have not seen too many companies follow suit and take the leap into externality costing and disclosing the results. Partly because it is rather a complex exercise. And if you think monetizing environmental externalities is tough, then social externalities and their far-reaching impacts are even tougher to assess. And disclosure is a risk. WBCSD maintains that we will only ever be able to know the true cost of business if we make progress in understanding, assessing and accounting for these external costs, and is encouraging its members to make bolder moves in this direction. That's the essence of "redefining value", one of the strategic priorities of WBCSD in the organization's Action2020 program. The sustainability leaders in our panel discussion believe the process of externality costing adds real value.

Masisa is a company with a strong passion for sustainability and a vision through to 2050.


Masisa publishes an Annual Integrated Report and in 2013, for the first time, published monetized impacts.


Roberto Salas described one approach to externality costing on the social side. He talked about the work Masisa does in communities, considering a range of community needs and managing social development over time. His view is that, by taking a small number of social indicators, and tracking development over a period of several years, social impact will be quantifiable and correlatable to corporate interventions and positive actions. Monetization is not a one-off thing. Externality costing must be viewed as a long-term activity.

Roberto Pedote of Natura shared an important insight. Natura has not yet published an EP&L but they are working internally to develop this. Roberto made the point that the EP&L, however, is not about precision. It's about the trend that the numbers show over time, and the ability to compare the size and scale of impacts as they occur throughout the value chain. This will never be a completely precise exercise, and although it's about numbers, it's not the numbers that are most important. It's the understanding of relative weightings of different material impacts, and deep internal discussions about the accountability of the company to mitigate or improve them. As such, externality costing can be an extermely useful internal engagement and decision-making tool.

I asked the panel if stakeholders are actually asking for EP&L's? Is anyone really all that interested? The response was that, while there are not many explicit demands for this specific calculation, stakeholders are showing more interest and demanding greater transparency from companies. The requests that stakeholders make for information are often those that can be met through the work that an EP&L reqires. Doing the work on some form of EP&L accounting enables companies to respond to broader stakeholder demands for transparency in a more considered and thorough way.

I have to confess to having been somewhat dismissive of EP&L accounting prior to the session and the research I did in preparation and pre-conversation with the panelists and their teams. I had always felt that we spend too much time in analysis-paralysis and not enough time taking bold action. But, now, after engaging with such clear-thinking, driven and enlightened leaders, I am more open to hearing the benefits. As Marie-Claire Daveu, the champion of EP&L pointed out: How can you act without a tool to help you evaluate priorities in a holistic way?

While EP&L may not be everybody's double-fudge ice cream, it's a tool that seems to be helping some of the world's leading companies move forward and it's bringing the discussion around sustainable development to another level. We should probably keep our eye on externality accounting. My guess is that we will be hearing a lot more about it in the coming years.


elaine cohen, CSR consultant, Sustainability Reporter, HR Professional, Ice Cream Addict. Author of Understanding G4: the Concise guide to Next Generation Sustainability Reporting  AND  Sustainability Reporting for SMEs: Competitive Advantage Through Transparency AND CSR for HR: A necessary partnership for advancing responsible business practices . Contact me via Twitter (@elainecohen)  or via my business website www.b-yond.biz   (Beyond Business Ltd, an inspired CSR consulting and Sustainability Reporting firm).  Check out our G4 Report Expert Analysis Service - for published G4 reports or pre-publication - write to Elaine at info@b-yond.biz to help make your G4 reporting  even better.  

Saturday, September 6, 2014

Telekom Austria : G4 game-changer?

Did Telekom Austria change the game with its first G4 report? This post continues my analysis of what changed with G4, this time using Telekom Austria  reports over three years.

For an overview of what all this means, see this post.
For a G4 game-changer analysis of Fiat Group, see this post.
For a G4 game-changer analysis of Ahlstrom, see this post.
For a G4 game-changer analysis of Johnson&Johnson, see this post.

For a game-changer analysis of Telekom Austria, read on......

Telekom Austria 2013/2014 Sustainability Report: GRI G4 Comprehensive, 92 pages
Telekom Austria 2012/2013 Sustainability Report. GRI 3.1 A+, 86 pages
Telekom Austria 2011/2012 sustainability Report, GRI 3.1 A+, 58 pages


The first thing that may strike you about Telekom Austria reports, G4 or otherwise, just by looking at the covers, is that they are super-creative. I can't understand how I missed the 2012 report - The Sustainables! - brilliant. Disclosing your sustainability impacts in the form of a Marvell-style SuperHero comic book is a fantastic way to get people interested in your report. It certainly captured my attention.


I was dazzled by Telekom Austria's 2012 report and had to look back at previous years' reports as well. There is definitely a creative flair to sustainability reporting at Telekom Austria that is one of the best I have seen and is consistent over the years. But it's more than just a creative design or infographic. It seems to stem from deep thought about what sustainability means to Telekom Austria. Each report tells a real story of sustainability practice using an imaginative and innovative approach that, each year, is slightly different and reflects the current report theme well. I like it!

The report is hyper-linked throughout - and all GRI G4 disclosures and indicators are annotated in the narrative and linked to the GRI Content Index, making it easy to find what's where. Telekom Austria refers to its report as a "magazine", and, although the framework is GRI and G4, it really does read like a magazine with very interesting articles and background information to add perspective and context.


Materiality - drives the report or just for show 
Telekom Austria uses its 2012 materiality assessment for its 2013 report. There was no materiality process in 2011.


The 23 material issues are grouped into four sustainability priorities that govern the structure of the 2013 report, just as they did the 2012 Sustainables comic book report. 
  • Providing responsible products
  • Living Green
  • Empowering People
  • Creating Equal Opportunities
In this report, in general, the four priority themes include the stated material issues. Data protection is the number one issue. In G4, this would be material Aspect "Customer Privacy" with an indicator relating to privacy breaches (G4-PR8). This is covered well in the report narrative and the indicator is reported. Network infrastructure is the second issue and this is mainly correlated to a material Aspect from the draft telecommunications sector supplement. This is reported in the company's annual report, not the sustainability report. Customer satisfaction is the third most important issue, and the response to G4-PR5 (customer survey results) is that there are no results yet as a new survey has just been completed. However, these three top issues appear to be addressed appropriately in the report. 

This is not the case with the lesser issues. The least important material issue is noted as  "sponsorship of arts, culture and sports". This is not correlated to any G4 material Aspect in the Telekom Austria report. We might consider a correlation to G4-SO1 (programs with local community engagement) but this indicator is not reported. We might consider it to correlate to G4-EC8 - indirect economic impacts. But responses to G4-EC8 in the Telekom Austria report relate to developments in communication technology and products that "make life easier", which have nothing to do with sponsorship. The second least important material issue is "open discussion in the digital world", whatever that means. This is not correlated to any material Aspect and I have no idea whether it's reported or not or how it is measured as I really don't know what it relates to. Therefore, while I think Telekom Austria does a good job of reflecting the material focus in this G4 report (just as it did in the 2012 G3.1 report), covering the main themes and most important issues, there seems to be a lack of rigor in correlating all the material issues to actual performance and impacts within the G4 framework.  

Focus - focused and relevant or ticking the boxes
This is a comprehensive level report so there are more boxes to tick than a core report. It's certainly no shorter than the previous two reports and almost double the length of the 2011 report. However, Telekom Austria has not reported on Aspects that were not defined as material. occupational health and safety (social), biodiversity, use of materials, supplier assessments for labor, environmental and social practices, and many aspects of human rights (although it's noted that this is because the data is not available, not because certain human rights indicators are not material). All the indicators in the draft telecommunications sector supplement are reported. Generally, then, it seems that Telekom Austria has made a focused selection, even if the focus is rather broad - 23 material issues is quite a lot. 

Engagement - process or lip-service
Telekom Austria doesn't go overboard in describing it's stakeholder engagement process in 2013. It was an online survey of 300 internal and external stakeholders. The results are not disclosed. It's not clear what was asked, who responded, or who said what. It's not clear to what extent the survey results influenced the selection of the issues. It's not clear who made this selection. All of this was described in the 2012 G3 report, and again, almost word for word in the 2013 report. Does an online survey constitute stakeholder engagement? Well, there are surveys and surveys. However, my personal view is that there is no substitute for a good 'ole conversation. I believe there is room for more robust activity in this area. 

Integrity - shapes up or misleads
I think this report does a good job of reporting the indicators that the company has selected to report. In each section, there is a hyper-linked disclosure or performance indicator that shows you where the commentary fits in the G4 Content Index. And for people like me, there's a treat. They say flattery will get you everywhere, and Telekom Austria knows how to make us GRI geeks feel special. In each section there is a catch-all for indicators not reported in the narrative, specially created for "GRI Experts". Thank you, Telekom Austria, for your consideration.


Impact - what we did or what difference we made
It's a little hard to distill actual impact in Telekom Austria's report. The amount of context and interesting background information enables you to understand why they are doing what they are doing. That gives great perspective on what's needed in society. Telekom Austria's "Creating equal opportunities" focus area has the potential to impact society in the broadest way, reflecting a sort of social mission, which is of course hard to quantify. In this section, Telekom Austria refers to programs to promote media literacy, inform about internet safety, support social entrepreneurs etc. In general, this is about Telekom Austria supporting, initiating, expanding, publishing, implementing, developing, increasing and simply doing more. It's all good stuff, but, beyond a couple of areas where the number of beneficiaries or participants is noted, I didn't get a sense of how all of this is making a difference. 

Telekom Austria publishes a separate status of performance against targets for all its subsidiary companies called the "Measures Programme". Here too, although this is fabulous from a transparency standpoint, I was not able to discern any direct measurement of impact (as opposed to reach).  

It would be nice to see Telekom Austria use its amazingly innovative and creative capabilities to develop some measures that go beyond participation. Although Woody Allen is noted for saying "80% of success is showing up",  I wonder if providing 100,000 people with media skills training actually means that 100,000 people actually become more media literate. Maybe I am just a skeptic. 

Game-changer - does or doesn't?  
This report isn't really a G4 game-changer for Telekom Austria, interesting though it is. The company moved to materiality-oriented reporting in 2012. In the conversion to G4, aside from changing the numbers of the disclosures and performance indicators, there is nothing too new. In fact, there is not enough new, and the specific requirements of disclosure of stakeholder feedback and engagement process, alignment of material priorities to G4 material Aspects, identification of material Aspect boundaries and performance indicators in line with material issues - none of this is truly present in 2013. Despite such an engaging approach to telling the story, I feel the 2013 report adapts the mechanics of reporting to G4 rather than truly providing a step-up in Telekom Austria's reporting approach. But, as with my analysis of Johnson and Johnson's G4 reporting, the path to G4 was already paved a year in advance with a more strategic approach including a materiality process and report face-lift in 2012. 

I give this report a 67% rating, the best so far, but not good enough to really change the game at G4 level. 

Material issues -80%
Focus  - 70%
Stakeholder Engagement -  45%
Integrity -  75%
Doing or impacting -  65%

This completes four game-changer analyses. Watch  this space soon for a summary-so-far of trends and insights. And then, maybe some more analyses. 


elaine cohen, CSR consultant, Sustainability Reporter, HR Professional, Ice Cream Addict. Author of Understanding G4: the Concise guide to Next Generation Sustainability Reporting  AND  Sustainability Reporting for SMEs: Competitive Advantage Through Transparency AND CSR for HR: A necessary partnership for advancing responsible business practices . Contact me via www.twitter.com/elainecohen   or via my business website www.b-yond.biz   (Beyond Business Ltd, an inspired CSR consulting and Sustainability Reporting firm)

Monday, December 23, 2013

Santa's 2013 G4 Sustainability Report

This year, Santa has published a G4-based Sustainability Report, in accordance with G4 comprehensive level. This follows a long tradition of sustainability reporting by Santa. Check out Santa's prior reports:

Santa's First Integrated Financial and CSR Report 2012
Santa's 1,747th 2011 Annual CSR Report  
Santa's 1,746th 2010 Annual CSR Report   
Santa's 1,745th 2009 Annual CSR Report

As usual, Santa always sends me an early copy of her annual sustainability disclosure, as she knows that the #CSR Reporting Blog is the most widely read blog anywhere that focuses on sustainability reporting. Knowing that featuring on the #CSR Reporting Blog is a privilege reserved for few reports, Santa always makes it worth our while by collecting all the toys that were not distributed to the world's children and sending them along to us on Boxing Day as a gift. This coming Boxing day, the #CSR Reporting Blog has decided not to accept these toys, but to donate them to bloggers everywhere, in return for a small postage fee. If you are a blogger, and would like to receive your free toy on Boxing Day, please make a bank transfer NOW to the #CSR Reporting Blog in the amount of $4,995. As soon as we confirm this amount has reached our account, we will dispatch your free toy. 

This year, Santa remains at the forefront of Sustainability Reporting. Last year, Santa's forefront was an Integrated Report, the first one to come out of Lapland, and the only Laplandish Integrated Report to include an Environmental Profit and Loss Balance Sheet whose bottom line was positive, meaning that the environment actually owes Santa a whole lot of money. This positive balance was due to the fact that elves multiplied carbon emission reductions achieved in Lapland by 196, the number of countries in the world, because Santa mentions all these countries in the Integrated Report as target destinations for toys delivered to kids. This exponentially increased Santa's carbon emission reductions and is perfectly credible, using methodology similar to the way the number of sustainability disclosures in Angola is calculated. In the meantime, Santa is trying to figure out how to actually get this money back from the environment, and, if all else fails, may have to ask PUMA to cough up the cash as they owe the environment around EURO 145 million based on their 2010 results. Santa's first Integrated Report for 2012 was helpful to the wider business community as it proved that the phrase "integrated reporting" is actually an oxymoron. This should go down in history as a massive benefit for humanity. It sort of equates integrated reporting to discovering that there is life on Mars. 

As Santa likes to demonstrate leadership, advanced-thinking, clear focus, sharp analytical skills, strategic visionary orientation, exceptional interpretive powers and amazing persistence, tenacity and staying power, she decided that this year's report should be written in accordance with G4. The only problem was working out what to call it. Santa consulted SOAP's CSR Report Name Generator and came up with some relevant options:


However, Santa felt that these report titles have been over-used, and decided to generate her own report title. So here it is:

Santa's 2012 G4 Sustainability Report


Chairwoman, President, CEO, CFO, and General Counsel Opening Message

As 2013 draws to a close, our work begins. With a core mission of making kids happier, while increasing the long-term sustainability and short-term profits of toy manufacturers around the world, Santa Claus Inc. is getting ready to make this Christmas the most memorable ever. With the digital divide creating gaps between those who have and those who want to have, we are giving priority to those who are disempowered by the digital divide. All they need to do is drop Santa an email, or use Santa's new IOS7 App, and tell us how the digital divide is limiting their ability to connect with the world at large and VOD at home. We will email back with the Santa Guide to Bridging the Digital Divide. This is a short 300 page manual, in two parts, which is very easy to understand, providing good advice on how to hack hot spots and divert satellite dishes.

Business-wise in 2013, Santa Claus Inc. delivered record profit levels, mainly because we achieved a higher degree of vertical disintegration, outsourcing not only our toy manufacture but also our testing procedures. In previous years, toy testing has been a major drain on our resources and over 18,000 elves were engaged in playing with all the toys we distribute to the world's children, to ensure they are safe and function in the way intended. To do this, the elves had to play with the toys in prolonged intensive sessions in which they had great fun but which usually ended up with the toys breaking or parts dropping off, or in some cases, elves choking to death. This meant that our pass-rate for acceptable toys was extremely low. In order to reduce our expenses and increase our toy pass-rate, we have transferred responsibility for toy-testing to our outsourced toy manufacturers, who are obliged to confirm toy integrity before shipping. We believe this has been an extremely positive change as our toy pass rate is now more than 100%.

Material Issues 
In line with G4 guidelines, this year, for the first time ever, we conducted a materiality analysis. We followed a process of stakeholder engagement with internal and external stakeholders, including consultation with the global sustainability guru, John Elfington, an expert in sustainable elf matters, and Jo Elfino, editor of a sustainable business newspaper for elves in the UK. 

We identified our key stakeholders as:

  1. Me, Santa Claus
  2. Children
  3. Parents
  4. Employees (elves and reindeer)
  5. The Government of Lapland
  6. Our Bank Manager 
  7. Environmental Activists
  8. Elf Trade Unions
  9. Toy Manufacturers
  10. Toy Testers
  11. Sleigh Manufacturers
  12. Reindeer Feed Suppliers
  13. Wrapping Paper Suppliers
  14. Chimney Sweeps
  15. Santa Defense Fund Management
  16. Santa Retirement Fund Management
  17. Santa Benefits Committee
  18. Santa Protection Agency
  19. Santa Well-being Organization
  20. Santa Earn-More-Money Campaign.
Given such a long list of stakeholders we were not able to complete our stakeholder engagement program in time for our Sustainability Report and have therefore assumed we know what most people think. This assumption resulted in a comprehensive and balanced set of most material issues, which we prioritized to deliver a list of 6 main issues that our report focuses on. These are our most material issues:
  1. Improving (Urgently) Santa Compensation and Well-being
  2. Advancing Santa Recognition around the World
  3. Busting the Santa Disbelievers Movement
  4. Ensuring the Ongoing Viability of the Chimney Sweep Profession
  5. Increasing the Longevity of Elves and Reindeer
  6. Ensuring Children do not Express Dissatisfaction with Toys Received
Our new Santa Sustainability Strategy for 2050 will address these material issues and ensure we maintain our license to operate and deliver a positive net contribution for humanity including generations to come and tremendous shareholder return. 

We submitted our report to GRI for the Materiality Matters Application Level Check, but were told that the GRI team is so completely underwhelmed with the number of companies submitting their reports for the check that they are considering revising the check to a "Materiality Matters As Well" Check, reverting to confirming that reporters have simply ticked the right boxes. As we await their conclusions, we take comfort in the fact that we can now declare our report as meeting the "in accordance" requirements and no-one will tell us anything to the contrary.   


New Shared Value Services
This year, in addition to distributing toys for children around the world, we decided that Santa should become more inclusive and we therefore started marketing a Santa Adult Toy range. This includes adult toys not typically suitable for anyone under the age of 37, and no, I won't go into details. Suffice it to say that the elves toy testing team was very sorry when adult toy testing was outsourced. However, this has posed a bit of a problem. Some of the adults have the same names as their children, and in a few cases, shipments were delivered to the wrong recipient. We are currently facing litigation for damages relating to a 5 year old boy who went into shock after an inflatable life-size doll exploded in his face, and a 6 year old girl who locked herself in a pair of handcuffs and was prevented from joining Christmas dinner festivities with her family.

In 2013, in order to get closer to our stakeholders, we opened up our Santa Claus Visitor Center here in Lapland. We are now offering round-trip packages from wherever you are in the world, accompanied by travel emission offsets so that you can take your trip with a clear environmental conscience. We intended that income from offsets would support the development of renewable electricity from combustion of reindeer antlers. Unfortunately, de-antlering all our reindeer proved problematic, and we already ruined 43 chain-saws in the process. Therefore we moved to plan B, which involves cloning Rudolph the Red-Nosed Reindeer, so that we can use all those reindeer red noses to provide lighting for all our operations. As reindeer have not yet been cloned, we feel this is a fabulous example of pioneering shared value sustainability progress, and we look forward to welcoming you to our Santa Claus Visitor Lit-by-Reindeer-Noses Center sometime in 2014. Aside from knowing your visit is carbon-neutral, you will also be able to chart the history of Santa Claus using our new android app, examine reindeer droppings through the ages, see elf fashion through the centuries, taste nutritional low-salt home-made probiotic reindeer-flavor yogurt, and read all Santa's previous Sustainability Reports. While the Visitor Center targets a population with a mental age of below 15, we also welcome politicians, CEOs and government officials.   

Reindeer Rights
Last year we had three complaints from the Global Reindeer Rights Protection Association (GRRPA) claiming that we are not paying our reindeer a living wage. We responded that we pay them a wage and they are living, and therefore didn't understand the problem. In order to deflect further complaints, we entered into a collaborative relationship with the GRRPA as they address the issue of reindeer trafficking. Trafficking affects some thousands of young reindeer, who are enticed from their families at an early age with the promise of well-paying jobs delivering toys in Hollywood and Bollywood. Once in the clutches of the reindeer traffickers, they are starved, drugged, abused, stripped of all reindeer dignity and forced to give reindeer rides for toddlers in shopping malls located anywhere but Hollywood and Bollywood, after which they end up as reindeer soup in high-end restaurants. By comparison, our 23-hour work day during the 12 days of Christmas is an attractive proposition. Our collaboration with the GRRPA includes a full employee communications kit and a compilation of visually disturbing videos of dignitaries eating reindeer parts at ceremonious dinners. These communication kits are designed to help all reindeer in Santa's employ realize that they actually have an easy life and that additional requests for protection of their rights will be met with disdain. In 2013, this worked and zero complaints were submitted to the GPPRA.

Elf Empowerment
As part of our ongoing investment in elf personal and professional growth, we created a special Elf Leadership And Talent Exceptional Development (ELATED) program which includes a 360 degree assessment of elf talent, capabilities, competencies and professional and personal relationships. Over 14,000 elves have already taken the ELATED program, participating in 5 residential workshops, meetings, online support and personal coaching from a senior elf mentor. Of the 14,000 elves who took the program, 3 were found to have some leadership and talent, and as soon as they realized this, they left the company to find better-paying jobs. We have therefore decided to replace this program with a new one, called the Developing Exceptional Forward-thinking Leadership And Talented Elves (DEFLATE) which focuses on helping elves continue to do the things elves do badly. This will increase our elf retention rate and save costs, while ensuring that all kids around the world receive at least one gift at Christmas time, even if it is the wrong one and arrives in more pieces than intended. 

Ethical Supply Chain
I was very distraught this year by the fire in the Rana Plaza operation in Bangladesh. It was a major tragedy to see so many people lose their lives due to unsafe working conditions. As a result, I personally visited all our toy manufacturing facilities in Bangladesh and asked them to ensure that all workers wear safety goggles and white overalls. Safety procedures may not have improved but at least the workers look good. Further, we considered joining major apparel manufacturers in signing the new Accord on Fire and Building Safety on Bangladesh until we realized this entailed a payment of $500,000 per year. At this point, we decided that outsourced facility safety is not a material issue for Santa Claus Inc. and deleted it from our list. 

Bad News
Survey results published by CorporateRegister.com in 2013 demonstrated that report readers find reports more credible if they contain bad news. I have been wracking my brain to try to come up with some bad news for this report. Santa Claus Inc. makes such a positive impact on the world and we do everything so perfectly, that bad news is just not in our lexicon, and even if it were, why on earth would I risk tarnishing our reputation so that the four people who read our report each year will find it more credible? These four people are my parents and my two daughters, and they believe anything they read anyway. 

However, as we are leaders in our field, and leaders must be responsive to stakeholder needs, here is some bad news. In 2012, we had a minor injury in our logistics operations when a fork lift truck driver elf backed into a wall. The elf sprained his right wrist on impact. He did not lose working hours and carried on driving the truck without his right wrist. The wall did not collapse and the fork-lift truck continued to operate. Nevertheless, we treated this safety incident very seriously and ran a series of elf discussions to highlight the necessity of not placing walls on fork-lift truck routes. We mapped the location of all our walls, and decided to relocate 27 walls to other positions outside the building. The bad news is that after we removed the walls, the roof collapsed, killing 32 elves and injuring another 346.  

Vote for Santa 
Even though our last report was not shortlisted in the online CRRA '14 global reporting awards, I take great interest in these online awards which advance reporting and help us learn from reporting best practice around the world. It is important to ensure that reporting remains a value adding exercise and continues to support an entire industry of specialists, as well as providing material for the CSR Reporting Blog, which so generously gives exposure to Santa's annual Sustainability Report. However, I am fairly certain that the fact that the Santa Claus Inc. 2012 report was not shortlisted is an oversight. Therefore, I suggest you vote for Santa Claus Inc.'s report anyway. Just delete the name of one of the other reports and manually add in the Santa report. We have made it our objective to achieve number one place in all reporting categories, and you can help. Please make this reporting year an even more memorable one for Santa. Double gifts for your kids in 2014 if you vote. Voting is open through January. 


Thank you for taking an interest in the Santa Claus 2012 G4 Sustainability Report. To read the entire 734 page report, please make sure you have a 100mbs broadband connection, about fourteen hours to spare and a supply of sedatives, and download it from our website. We will be happy to receive your feedback, as long as it's positive. 

In the meantime....

We Wish You and Everyone in the World a Happy Holiday Season and a Happy New Year. 
  

elaine cohen, CSR consultant, winning (CRRA'12) Sustainability Reporter, HR Professional, Ice Cream Addict. Author of Understanding G4: the Concise guide to Next Generation Sustainability Reporting  AND  Sustainability Reporting for SMEs: Competitive Advantage Through Transparency AND CSR for HR: A necessary partnership for advancing responsible business practices . Contact me at www.twitter.com/elainecohen   or via my business website www.b-yond.biz   (Beyond Business Ltd, an inspired CSR consulting and Sustainability Reporting firm)
Related Posts with Thumbnails