Showing posts with label #csr. Show all posts

Wednesday, July 3, 2024

GRI revises employment standards. Shoot me now.

Yes, we’re back at the CSR Reporting Blog. Apologies for too long an absence due to so much time working on reporting rather than writing about reporting. But this new GRI brainchild was too good to pass up.

GRI has published exposure drafts for the first phase of its employment and labor standards revision, introducing new and completely unique disclosures. Just when you thought ESRS was enough to mindblow even the most energetic of reporters, GRI has generated 13 original multipart disclosures and revised (expanded) 8 disclosures, all from 5 existing ones. It’s the GRI multi-stakeholder Mary Poppins at work again pulling more metrics out of the bottomless carpet bag.

We are truly in the age of mega mushrooming of metrics, where every new standard adds to the reporting burden in a way that I fail to believe is what's needed to advance sustainable development and protect people, society and the environment. There’s a point at which disclosure becomes dysfunctional rather than constructive. It makes you wonder when we will have a metric for how many times people use the bathroom – broken down by gender, region, employee category (including workers who are not employees) and time spent per visit. Let’s just hope that this disclosure requirement doesn’t include details of bathroom activities.

Despite reverberating declarations of cooperation, collaboration and undying love between the prominent standard setters (notably GRI, IFRS and EFRAG), here we go again: GRI proposes more unique disclosure requirements that do not appear in any other standards (as far as I can ascertain). But don’t worry, I am sure, once the new standards are finalized, GRI will publish an interoperability guide. That will make everything so easy. Not.

(The GRI-ESRS Interoperability Index will need quite some updating.)

What does this first phase revision cover?
This first phase covers topics relating to 
  • Employment practices and conditions 
  • Working life and career development 
  • Worker’s rights and protection 
that are part of GRI’s existing standards: 
  • GRI 202: Market Presence 2016 (Disclosure 202-1) 
  • GRI 401: Employment 2016 (Disclosures 401-1 and 401-02) 
  • GRI 402: Labor/management Relations 2016 (Disclosure 402-1) 
  • GRI 405: Diversity and Equal Opportunity 2016 (Disclosure 405-2) 
There is also a new draft, Standard Interpretation to GRI 2: Control of work, which aims to clarify the ‘control of work’ concept which is used to identify reporting requirements in some of the standards. 
All drafts and surveys are available here for public comment by October 4th. Sorry if that ruins your summer. 

General takeaways 
More policy please: In line with more recent GRI revisions, these new standards integrate topic-specific management disclosures in addition to the management disclosures required by GRI 3: Material Topics 2021. This means you can’t get away with a high level policy overview – each topic includes disclosures that are mandatory within that standard and, in some cases, require quite explicit responses. 
Gender expansion: Gender has expanded in the reporting world these days. Most of the proposed disclosure requirements ask for data breakdown by gender. In addition to female and male genders, there are now two more categories: Other (Gender as specified by the employees themselves) and Not Disclosed (Gender is not disclosed by the employees themselves.) 
Enter the age of the non-employee worker: GRI’s new disclosures relating to employee practices now expand to include information and metrics relating to both employees AND “workers who are not employees’. EFRAG (ESRS) calls these “non-employees” which rolls off the tongue a little more easily. Apparently, the interoperability spirit did not sync far enough to align on terminology. (I will continue here using the EFRAG term to reduce keystroke fatigue and lower my typing-time carbon footprint.) 
GRI’s new guidance on who is a non-employee aims to unblur the rather confusing guidance already published. “Workers who perform work for the organization and whose work is controlled by the organization but are not in an employment relationship with the organization. Control of work implies that the organization directs the work performed or controls the means or methods for performing the work. ….. [for example]….agency workers, apprentices, contractors, home workers, interns, self-employed persons, sub-contractors, and volunteers”. 
It’s still a bit blurry, I think (EFRAG actually does it better, see ESRS S1 AR61-65).           

The draft standard goes further than any previous standards regarding the reporting of many aspects of policies and practices relating to non-employees. For example, required reporting for BOTH employees AND non-employees incudes aspects of external and internal recruitment, performance management, performance reviews, data protection, termination, hours of work and rest, remuneration rates, social protection contributions and management of the effects of operational changes including redeployment or upskilling. These disclosures can be understood when accounting for impacts on own workforce, but the need to report so extensively on non-employees seems excessively burdensome to me. By comparison, ESRS S1 Disclosure Requirement S1-7 requires: The undertaking shall describe key characteristics of non-employees in its own workforce. This includes “disclosure of the total number of non-employees in the undertaking’s own workforce, i.e., either people with contracts with the undertaking to supply labour (“self-employed people”) or people provided by undertakings primarily engaged in “employment activities” (NACE Code N78).” All other details about non-employees in ESRS are optional disclosures (except in the case of health and safety, Disclosure Requirement S1-14, which makes sense). 

I believe that organizations should indeed be held accountable for work arrangements for non-employees (such as safety, privacy, working hours and conditions etc.) and in all cases should take measures to ensure non-employee rights are upheld though proactive monitoring/auditing of contracts with employment agencies or contractors or self-employed parties. I think there’s a case for separating these disclosures: one standard should apply to direct employees, and most companies would identify own workforce or subtopics thereof as material; a separate standard should cover the way organizations manage practices related to non-employees, which could be selected by companies that identify non-employee issues as material, perhaps those companies employing a very high rate of such workers. Jumbling up everything all together to me places an unnecessary burden on reporting companies and dilutes focus. 
NB: Let’s not confuse non-employee management with misclassification of workers as per the Uber ruling, where drivers were deemed to be workers and not self-employed. This form of “disguised employment” is addressed separately in the draft disclosures from a policy standpoint. 

In Accordance – too much? There was a time when declaring compliance to the full GRI Standards by being In Accordance was seen as a mark of leading practice among reporters. Many companies claim to report In Accordance to signal leading transparency (although there is quite some corner-cutting in most cases). Now, I am wondering if the burden of such extensive reporting will lead companies to pick’n’mix, preferring to “reference” GRI Disclosures rather than aim for In Accordance. I have always advocated for relevant transparency, not all-out transparency. I think these new draft standards proposals step over the line of reasonable and constructive disclosure. Read the drafts. Decide for yourself.

Key takeaways: Employment Draft Standard GRI 404-1 
Got a grievance? GRI’s got you covered: The strong influence of human rights thinking is clear in this revision, with almost all disclosures referencing grievance mechanisms, appeals processes, adherence to fundamental principles and rights at work or worker representative engagement on different issues. If your reporting has conveniently glossed over human rights issues, this revision means no more. 
Do you pay your interns? You probably should, because now you will be asked to give a full account of remuneration for interns and explain why they are not paid, if they are not. No need to disclose what they have for lunch. 
Surprise surprise, privacy matters: You will need to disclose policies regarding employee and non-employee personal data collected, processed and monitored as well as how you obtain informed consent. It will be interesting to see how many employers collect information about employee shoe sizes or ice cream flavor preferences. Regarding the latter, I’ll happily give my informed consent. Additionally, a quantitative disclosure requires reporting of the number and types of incidents related to personal data protection and privacy of employees and non-employees. Incident means legal action or complaint or internal discovery of noncompliance. Companies are just going to LOVE this one. All that dirty washing hanging out there. Can’t see that happening any time soon. 
Saying goodbye? Now say how: A new full disclosure devoted solely to termination practices, including a description of the valid reasons for termination. I doubt any company will publish a policy relating to involuntary termination for reasons other than poor performance, misconduct or layoffs or variations on those themes. GRI explains that “This new management disclosure aims to increase accountability on the termination of employment or work. The termination policy is related to job security.” I am not sure how explaining your policy on firing people is related to job security. I would have thought the opposite is true. 
More and more and more data: Currently, the data requirement for the GRI 401-1 new employee hires and turnover indicator includes “total number and rate of new hires during the reporting period, by age group, gender and region,” and the same for turnover. The proposed draft expands this to include reasons for voluntary turnover and termination AND internal recruitment rate for employees and non-employees AND length of tenure by region for four different employee categories AND the number and turnover rate for non-employees by region. Ugh. Might as well just include a link to your HRIS database and be done with it. Another example: Currently, GRI 404-3 requires reporting of the percentage of employees by gender and employee category that received a performance review. In the new draft standard, it is also required to report how many non-employees received a performance review, and for those employees and non-employees who did not receive a review, why not! Hmm. Good luck with that one too. 

Key takeaways: Labor and Management Relations Standard 
This set of three multipart disclosures expands the single disclosure in GRI 402 that requires reporting the minimum number of weeks’ notice provided to employees regarding significant operational changes that affect them. The exposure draft goes way further to encompass details of how such changes are managed for both employees and non-employees. 
Don’t forget to consult: A key feature of disclosures here are how a company consults with workers’ representatives. Everything from termination and appeals procedures, notice periods and severance payments, the number of weeks spent in consultation with workers’ representative ahead of implementing changes and more are part of the draft disclosure requirements. 
Don’t forget to mitigate: For employees and non-employees, reporting requirements include actions taken to mitigate the effects of significant changes including redeployment, training and reskilling or layoffs. 

Key takeaways: Remuneration and Working Time 
This set of disclosures has gone into overdrive with more information and data requirements than ever before with three management (policy) disclosures and four multipart remuneration disclosures. Prepare to get granular on rem. This section includes elements from existing GRI 202-1, 405-2 and 401-2 and more. 
From minimum wage to cost-of-living: In GRI 202-1, reporters were asked to describe employee remuneration policies relative to the local minimum wage rules, if available. In the draft disclosures on remuneration, companies are asked to define remuneration policy including how this accounts for cost-of-living estimates and provide, for significant locations of operation: median gross hourly basic pay by employee category AND the number of employees who are paid at the local minimum wage AND number of non-employees who are paid at the local minimum wage AND the cost-of-living estimate AND the number and percentage of employees whose basic pay is at or above cost-of-living estimate, including a breakdown of employee category and gender AND steps taken to address gaps between cost-of-living estimates and basic pay for employees and non-employees. GRI conveniently provides a suggested template (one of several template proposals in this revision) for presentation of the cost-of-living metrics. For companies with more than three “Significant locations of operation” and more than three “Employee categories”, this is going to stretch the spreadsheet limits. 


By comparison, the ESRS requirement on remuneration references “adequate wages” where adequate wage is defined as the legal minimum wage or, if not available, in line with other relevant benchmarks. The organization is required to report (ESRS S1 Disclosure Requirement S1-10) “whether or not its employees are paid an adequate wage, and if they are not all paid an adequate wage, the countries and percentage of employees concerned.” C’est tout. 
There is also the question of what data or benchmarks to use to define cost-of-living estimates in each country of operation. GRI recognizes that there is no universal formula for calculating cost-of-living, and this can vary extensively depending on what you include. GRI guidance explains: “Cost-of-living estimates are approximate calculations determining the necessary amount to cover an individual and their family's basic expenses like food, housing, and healthcare in a specific location. Different methodologies can be used to derive the cost-of-living estimates as there is no international agreement.”
I also wonder if the often-referenced living wage concept is different from the cost-of-living concept. Either way, any reporter counting this as material will need to set up a whole new database to meet the needs of this disclosure, and every reporting company is likely to interpret cost-of-living differently. I have to wonder how valuable this is going to be in the grand scheme of how we ensure that remuneration is fair and decent for everyone. 
Working time – all is revealed: New disclosures 2 and 7 are dedicated to working time and requires detail of policies defining working and rest hours by day, week and year and metrics demonstrating how these were applied, including a breakdown of employees by type as well as non-employees with details of the number of hours worked by each type across four working-hour bands, in addition to other disclosures relating to additional aspects of working hours. Specifying overtime hours worked is not a requirement but in case anyone wants to volunteer, GRI generously shares an example template for presenting information on the number of overtime hours worked by employees by gender at significant locations of operation, with a breakdown by three bands of overtime hours. Additionally, the proposed draft asks organizations to describe how the working time policy considers the specific needs of vulnerable groups, including young workers and pregnant and nursing workers. 
Gender pay gap - still on the table: This disclosure is similar to the current GRI 405-2 and asks for percentage difference in average gross basic hourly pay of men and women for each employee category. No momentous change here, except that very few companies actually report a gender pay gap except for in those countries where it is a legal requirement to report, such as in the UK and certain other countries.
Social protection coverage: This is another extensively expanded disclosure requirement building on existing GRI 401-2 Benefits provided to full-time employees that are not provided to temporary or part-time employees. Rather than requiring companies to specific which benefits they provide (as current), organizations will now need to specify whether they provide any of a set of 8 benefits categories, alongside other disclosures relating to who gets what and where and if it’s required by law or otherwise. Specifically, there is a requirement to report how a company monitors that social protection contributions are made to relevant authorities according to local regulations for non-employees.

 ******* 

In conclusion, with this first phase of changes, GRI has created a wish list of disclosures in a topic that is material to most reporters in some way. Disclosure should never be just for the heck of it. It should provide useful and meaningful information that helps us understand the impacts of a company on society and the risks it faces. If the second phase of the labor standards revisions take the same mushroomy approach, it’s hard to predict an enthusiastic adoption rate by most reporting companies. 
These disclosures differ drastically from what was hailed as "disclosure standards on steroids" with the introduction of ESRS. ESRS went further than any other sustainability disclosure standard. Despite all the wonderful collaboration going on, these proposals are not aligned with ESRS in a way that enables reporters to comply with both ESRS and GRI interchangeably for a single disclosure on these labor topics: reporting fully against ESRS would not meet the disclosure requirements of these GRI draft standards. I have to wonder who has lost the plot here. Oops. Maybe it’s me! Obviously, I need more ice cream.🍦🍦🍦🍦


elaine cohen, GCB.D: ESG Competent Boards Certified (2021), Sustainability Strategy and Disclosure Specialist, former HR Professional, Ice Cream Addict. Owner/Manager of Beyond Business Ltd, an inspired Sustainability Strategy and Reporting firm having supported >160 client reports to date; author of three books and several chapters on Sustainability Reporting and the Human Resources connection to CSR; frequent chair and speaker at sustainability events and judge in several sustainability awards programs each year. Contact me via Beyond Business


Wednesday, December 28, 2022

23 Sustainability Reporting Insights For 2023

2023 will be another dynamo year for the reporting landscape. Alongside the development of standards and frameworks, interoperability, global baselines, materiality debates and promises of comparability, the hard work of reporting goes on and first-time, experienced and expert reporters continue to grapple with old and new disclosure challenges. 
Here's a round-up of some stuff that might be helpful as the 2022-2023 reporting cycle kicks in. Some of it may be familiar to regular CSR Reporting Blog readers - I am nothing if not repetitive - I am nothing if not repetitive - haha. But, well, some things need saying twice, or fourteen times. I am nothing if not repetitive. Let's get started:

1. The More You Sweat in Peace, the Less You Bleed in Battle
This saying is attributed to many people so I can't be sure who said it first. Paraphrased for our purposes: the harder you work now at preparing for compliance, the easier it will be to comply when there's no longer a choice. I think we all know that sustainability disclosure is heading toward its legal coming of age. This includes regulatory requirements governing the content of disclosures (especially on climate and nature), the timing and formats of publication and third-party assurance. While there's always a transition period, it flies by quickly. It's well worth ensuring you know which upcoming standards are likely to affect your business, from when, and starting to put in place the necessary building blocks to meet the new demands. A selection of the most prominent changes:
GRI 2021 and updated universal standards: This one should already be in the bag for GRI reporters. The changes apply for publications from Jan 1, 2023. Not regulatory but market-driven.
CSRD: As part of the Corporate Sustainability Reporting Directive, the European EFRAG-ESRS Standards, - the first 12 of them anyway, including  climate, water, biodiversity, circularity, workforce, community impacts and business conduct - were approved by the EU and will apply on a phased basis from FY2024 once ratified in EU member countries.
IFRS ISSB: The two initial proposed standards for general sustainability-related disclosures (IFRS S1) and climate-related disclosures (IFRS S2) are expected to be finalized any day soon. Implementation by law will depend on uptake in various jurisdictions. The UK has already thrown its hat in the ring.
 
2. Out of the Fire and into the Frying Pan
It pays to keep a level head when faced with the hype around how all the new reporting standards will make everything so much better/easier/more consistent. Agreed, there is some convergence that removes a layer of clutter and an acronym or three. IIRC, CDSB and SASB are now all one organization. But wait, the last time I looked, there is a new set of investor-focused standards called ISSB, as well as a set of SASB standards that ISSB will most likely consume or interoperabilize. There is another evolving set of European CSRD ESRS standards with its expected array of sector standards in the future. And GRI is continuing.. slowly but doggedly.. to develop its own suite of sector standards. TCFD and its nearly-newborn cousin TNFD are squarely in the mix. In addition there are stock exchange requirements around the world, including the upcoming intensification of climate disclosures for the U.S. SEC, and oh, let's not forget, the SDG framework and the politically correct imperative of public alignment. We have materiality, sustainability-related financial materiality, double materiality, dynamic materiality, none of which are applied using a consistent, clear or, in many cases, auditable methodology. Throw WEF SCM and CDP into the mix and even UNGPBHR. And how could we not mention the all-new bells-and-whistles UNGC COP with its multiple choice online questionnaire that resembles a low-grade intelligence test for reporting interns. 
So what's changed?  Fewer acronyms? More optimistic rhetoric? Belief in a new era of interoperability and comparability? What no-one is saying is that reporting will be no less challenging, no less complex and no more comparable in the future. Best not to get too taken up with the time you will save in this new disclosure utopia and and focus on developing robust internal processes that will ensure you tackle this complexity in the most efficient way. For example, ensure a consistent data collection process to create core datasets that can be easily sliced and diced to meet different reporting needs. As we are now in the frying pan, you'd better get better at making omelets. 

3. Switch out FOMO with JOMO
Fear Of Missing Out (FOMO) is not a good basis for disclosure excellence. Following the herd may not be the right thing for your business. By focusing on what you must disclose (regulators rule ) and what you need to disclose (your impacts, your accountability, not everybody's impacts), you can travel along the reporting highway at speed and get to your destination without unnecessary baggage. This is the Joy of Missing Out (JOMO) approach. Be joyful in saying: "No, this does not add value." GRI+ISSB(SASB)/CSRD+TCFD+CDP (plus regulatory requirements in different markets) seems to be the majority-rule common sense mix moving forward. They cover the information that anyone should reasonably need to know to evaluate a company's environmental and social impacts and risks. Maybe companies should work at disclosing diligently against these frameworks and only add more metrics if there is an explicit compelling business case to do so.  

4.  Be a Futurist not a Historian
Sustainability reports should reflect a year of past performance (frankly, I don't need your timeline going back to when you first learned the term sustainability) but increasingly, we expect reports to predict a little of your company's future and the way it plans to navigate the sustainability challenges ahead, mitigate risks and achieve its goals. Reporting content should balance the current state of play with future plans and initiatives. What you have done is not a guarantee of what you will do, so how you are moving forward is critical for an understanding of the level of your company's commitment and sound sustainability management. Oh, and a one-liner entitled "Looking ahead" that says "continue to contribute to xyz" doesn't really cut it. If you have no plans to drive progress on material topics, you should develop some. 

Here's an example found in a 2022 ESG Report, one of a series of stated goals:


Of course, there is much behind-the-scenes work that goes on in any company to maintain compliance with regulations, including anti-competition laws. Compliance is a business process that requires resources and attention and diligent management. But, for this company, anti-competitive behavior was not explicitly declared as a sustainable development material topic, and there is no discussion about anti-competitive challenges in the report itself. What's the value of a target such as this? Isn't it a bit like having a goal to brush your teeth every morning? Or a goal to walk the dog twice a day? For me, a goal is not about maintenance, unless maintaining the status quo is expected to be extra tough because of new challenges that would send you off-course if you took no action. If so, I would expect to read about the challenges and the step-change that a goal such as this is designed to deliver. Otherwise, it's a bit of a stocking filler.  

5. Target Targets
I continue to be astounded that companies who declare "sustainability is in our DNA" while publishing creative and elaborate ESG strategies and attesting to intensive stakeholder engagement do not state their targets in key sustainability performance areas. Maybe they don't have any? Or maybe they are secret? Either way, lack of targets means lack of credibility. These days, when I read and review sustainability reports, I follow this path: (1) CEO letter (2) Materiality (3) Targets (4) All the rest. I look for consistency among the first three reporting elements. If there is a total disconnect, or if any of these elements are unconvincing, oops, I read all the rest with a high degree of skepticism, no matter how well-written or how beautifully designed it is. Companies that are serious about sustainability set SMART targets: Specific, Measurable, Achievable, Realistic, and Timely. Here's an example: 


This is from RDM Group, a privately owned recycled cartonboard business in Europe. This set of goals in the company's 2021 Sustainability Report is impressive to me because the goals are simply stated with a clear base year benchmark, long term targets and current progress. You get the full picture, quickly. Nothing fancy. The targets cover a range of sustainability topics rather than only climate or environment like many companies. Also, each of these targets represents progress. I can't comment on the degree of stretch or effort required to deliver these targets - that's a question for another day - but the public commitment is credibility affirmative.

6. Pathways Are to Targets as Fish is to Chips
Great. You published your 2030 targets, or your Net Zero by 2050 targets. Fantastic. But how many of your leadership team will be around in another 8 or so years to deliver your 2030 targets? Even fewer in 2050. To really get the credibility brownie points, you need to show how you will achieve these targets. Climate change reporting is getting better at this, with many companies sharing a pathway to Net Zero target delivery. But in almost all other areas, it's a guessing game, especially if the current performance is a step change away from the targeted performance. 

Anglo American's 2021 Sustainability Report provides a Net Zero by 2040 pathway that visualizes the complex elements of their decarbonization plan. 


7. Comparability Will Always be a Myth 
The thing about standards and frameworks is that there are always gray areas, and there are always companies who bend the rules, smoothen the edges and adapt the guidelines to what they can or want to disclose. Perhaps regulation might make a difference, but standards need to be extremely prescriptive in order for companies to use them in exactly the same way. Take a simple metric such as "Percentage of women in management". Every company has a different definition of what constitutes a management position, from first line supervisory to senior executive. Any benchmark I have ever done (and I have done many) of reports using GRI Standards are almost never comparable on a metric for metric basis. That's probably because no company is the same as any other, and the context in which any company operates is always unique to that company. I have never truly understood the obsession with comparability, between companies at least. For me, comparability for me means comparing any company against itself and its prior performance. That's why it's important to report consistently year on year, and explain any changes in methodologies or scope or underlying assumptions. 
Companies that issue a detailed metric calculation methodology make it easy for report users to know how metrics were developed, especially non-standard ones. Kingfisher plc does this well each year with detailed explanation of every core metric reported.


8: Materiality + Materiality  
Double materiality, or impact materiality and (sustainability-related) financial materiality, seems to be the way to go. Makes sense. Most of us want to know how a business is affecting our lives and the world (impact materiality) while the financial and investor community need to know how life and the world are affecting the business in order to evaluate investment risk. The material thing about materiality is that there is no universal methodology to define and prioritize sustainability impacts on and of the business. Many companies reference "importance to the company" or "significance to stakeholders" without actually defining what this actually means. Does importance to the business mean social license to operate or does it mean profitability? Does significance to stakeholders mean the issue is directly affecting them or that their general opinion is that the topic is important? Either way, companies should DEFINE what materiality means in their context and how they assess topics as material. In many cases, the process goes something like: "We created a universe of topics from a range of sources, we analyzed them with input from internal and external stakeholders and then selected the top 20 topics which were approved by the Board." This tells us nothing about the basis for analysis or prioritization. I believe there is an urgent need for a materiality assessment methodology to create a certain consistency in defining material topics. 

My approach to double materiality is to first create a list of potential impact areas, drawing from internal and external sources, and, after due analysis and discussion, assign an impact level to each, based on criteria that include business strategy, scale, scope and long-term effects of each impact. The result is a list of impact material topics. To determine sustainability-related financial materiality, the start point is the list of impact material topics, which is analyzed using additional criteria to assess the impact of the topic on the company's long-term profitability and overall success. Both these outputs deliver a single list of material topics, where some topics are material from an impact and a financial standpoint while the rest are material from an impact standpoint only. There are no financially material topics that are not material from an impact standpoint - if there were, these would be part of the financial disclosures, not sustainability disclosures. 

A good example of this is from Sri Lankan Talakawelle Tea Estates in their Annual Report 2021/2022.


Sustainability topics are assessed from both an impact and financial standpoint and all topics above a certain threshold are discussed in the Annual (and sustainability) Reports. Each topic is also correlated with risks and opportunities and explanations of how each topic was assessed in terms or risk or opportunity is described in detail. 


As methodologies go, this seems good to me. (N.B. I first saw this type of double-materiality approach used by Enel's 2021 Sustainability Report (p38). That's worth a look too, including a detailed description of how they did it). 

Here is another option from Westpac Group's 2022 Sustainability Supplement. It's a list with a few icons carefully positioned for visual interest. What I like about  this is that it splits the material topics into two parts - those that are primarily impact materiality, and those that also have a sustainability-related financial materiality element and are therefore included in the Westpac Annual Report (although not necessarily financially material from a corporate accounting standpoint). This is also a clear double materiality approach.  


9. Ditch The Mystery Matrix 
There have been multiple debates about the materiality matrix over the years, and I have always maintained that it's a misleading, distracting and time-wasting visualization of materiality prioritization. We need to know which topics a company considers material from an impact and/or a sustainability-financial standpoint. From my perspective, if it's material, it's material. Period. I don't think we need to mess around with shades of materiality...high materiality, low materiality, average materiality.... what difference do these labels make in terms of management attention, resource allocation, due diligence? All material topics should be assigned the level of resource required to address the need, the relative priority is superfluous to requirements. Typically, when faced with lots of dots on a matrix, I look to see which are the top topics (top right) and which are the bottom (bottom left). I then always find myself wondering why the bottom left topics are actually ranked so low by comparison to the ones ranked so high. It's mostly a big mystery.  

There are as many ways of presenting a materiality matrix as there are companies who publish them. But even disregarding the visual creativity, the force-fitting of dots or topics on a matrix is even more mysterious. Check this one out:

What's the point of having a matrix if all your topics are in one box? Why have 9 boxes when two will do?

Here's a similar unmatrix from Mondelez 2021 ESG Report. Why use a matrix representation for four equally prioritized material topics? 


On the other hand, if some visualization is needed because you have several issues and a simple list might be rather long, there are other options. This one from Marvell's 2022 ESG Report is clear enough.


10. If it's Material, Write About It
This might be obvious to many, but if you have identified a topic as material in your materiality mystery matrix or list of material topics, then please include content about it in the body of the report. Too many times the list of material topics seems like a garnish on the side of the plate, and not the actual main course. How would you like it if you went to a restaurant and ordered spaghetti bolognese and all you got was spaghetti? Ideally, you should help your report users find your material content. Here's a good example from Asus's 2021 Sustainability Report that shows the description of each material topic and the chapter of the report in which the topic is discussed.


11: Focus on the Delta - Invest in a Policy Bank
Annual sustainability reporting should concern itself with what I call the delta - the difference you made in the reporting year, i.e. actual actions and progress made. All the management approach and policy type disclosures are what I call evergreen, and do not need to be / should not be repeated every year. As an essential part of disclosure, however, they can live their evergreen life on the company website as reference documents for those who need them, with occasional updates when a policy changes. Eliminating this blurb from your annual report saves time and space and enables your report to be compact and focused and yes, useful. I am seeing companies do more of this these days. Here are a few:


Oracle Policy Positions - this is a single downloadable PDF with a set of positions, rather than single items on a website

(Disclosure: I count Johnson & Johnson and Caesars Entertainment as valued clients and assisted in development of their policy banks.)
 
12. Scope 3 is IN
If you haven't started to grapple with your Scope 3 emissions yet, now's the time. Scope 3 is buzzing and will be included in new (likely regulated) sustainability reporting standards going forward, requiring disclosure by Scope 3 component categories. Many companies are doing this well today, and those who disclose to CDP have generally considered this and created the relevant connections and reporting processes. Scope 3 is awkward of course because it relies on the collaboration of suppliers and other value chain players to collaborate in providing data.  

Microsoft's 2021 Environmental Sustainability Report reports Scope 3 in detail and is super-informative about the ways it addresses Scope 3 management and disclosure.


13. Assurance is IN
And you are probably also aware that third-party assurance of sustainability disclosures is now becoming a must-have. Building confidence in reported data is seen as a critical building block of trust and credibility in reporting. That's not to say that assurance always catches every glitch, but it introduces a robustness to the reporting process that is advantageous to companies, whether it's required by law or not. Limited assurance or reasonable assurance, of part or all information will definitely be part of the new game plan for ISSB and CSRD going forward, and U.S. SEC disclosure requirements on climate will also likely be subject to some form of assurance. Better get ahead of the game with some external verification in the next reporting cycle, because, in my experience, if you have never ever externally assured your sustainability information, the first time will be a heavy lift, and maybe the source of a few not-so-nice surprises. Good to iron out the creases before you have to disclose them.  
 
14. Ice Cream is IN
Do not even attempt to start preparing your next sustainability report without a freezer stocked with ice cream. Believe me, it's essential. I am actually dismayed that ice cream does not feature anywhere in the new ISSB or CSRD standard proposals. As a minimum, Maintaining a Continuous Ice Cream Supply should be a core reporting principle.

15. SDGs are More than Icons
It's almost not a sustainability report if it doesn't contain a selection of SDG icons, the most overused icons in the history of reporting. These days, every ESG strategy, every sustainability aspiration, every community case study and almost every second paragraph has an SDG icon or several in close proximity. Apparently we will respect your sustainability performance more if it's SDG iconized. That might have been the case when the SDGs were all new and shiny back in 2015. Now, it's SDG-wash. Unless you can be explicit about the SDG targets you are directly contributing to, it's probably not worth the extra ink. If your company truly endorses the SDGs as a strategy and not as an afterthought or a PR pickup, you will disclose how you are contributing to advancing which SDG targets with some specificity. General stuff like  "We occasionally donate to food banks" is not a meaningful response to SDG 2 Zero hunger. Setting a target to increase women in management is not quite enough to advance SDG 10 Reduced Inequalities. These actions may be in the right ball park but it's like telling the taxi driver to take you to Arizona when your actual destination is Big Looney's Ice Cream Truck on Ruby Way in Cottonwood, Arizona. 

Here's an example from Capgemini's 2021-2022 Environmental Sustainability Performance Report - explicit actions to support SDG targets. 


The Airport Authority Hong Kong's 2021/2022 Sustainability Report does a similar job, with several targets for each priority SDG.


16. Design for Use
I recently posted about report design (what works well, what to avoid) so I won't reproduce all of that here. Let me just stress one point. PDFs are read online. ONLINE. No one prints reports. We read them on screen. That means they must be suitable for on screen reading. Logical, right? Cue: NAVIGATION TOOLS. We need a way of moving around the report quickly and efficiently without having to CNTRL+HOME to get to the contents page every time we want to find something. Believe me, having reviewed more than 130 reports in two reporting award competitions in the past couple of months, the amount of time I wasted clicking back and forth in unnavigable reports probably amounted to longer than it takes me to binge watch 18 seasons of Grey's Anatomy. There are so many easy navigation tools available to report designers from hyperlinked side or top menus to a navigation tool bar that has home, forward and back buttons and any other number of alternatives.   

Hankook Tire and Technology's ESG Report 2021 2022 is easy to navigate. There is an unintrusive top menu that gets you back home and to any main chapter, and sections within each chapter are hyperlinked on each section lead page.


17. Out Your Board 
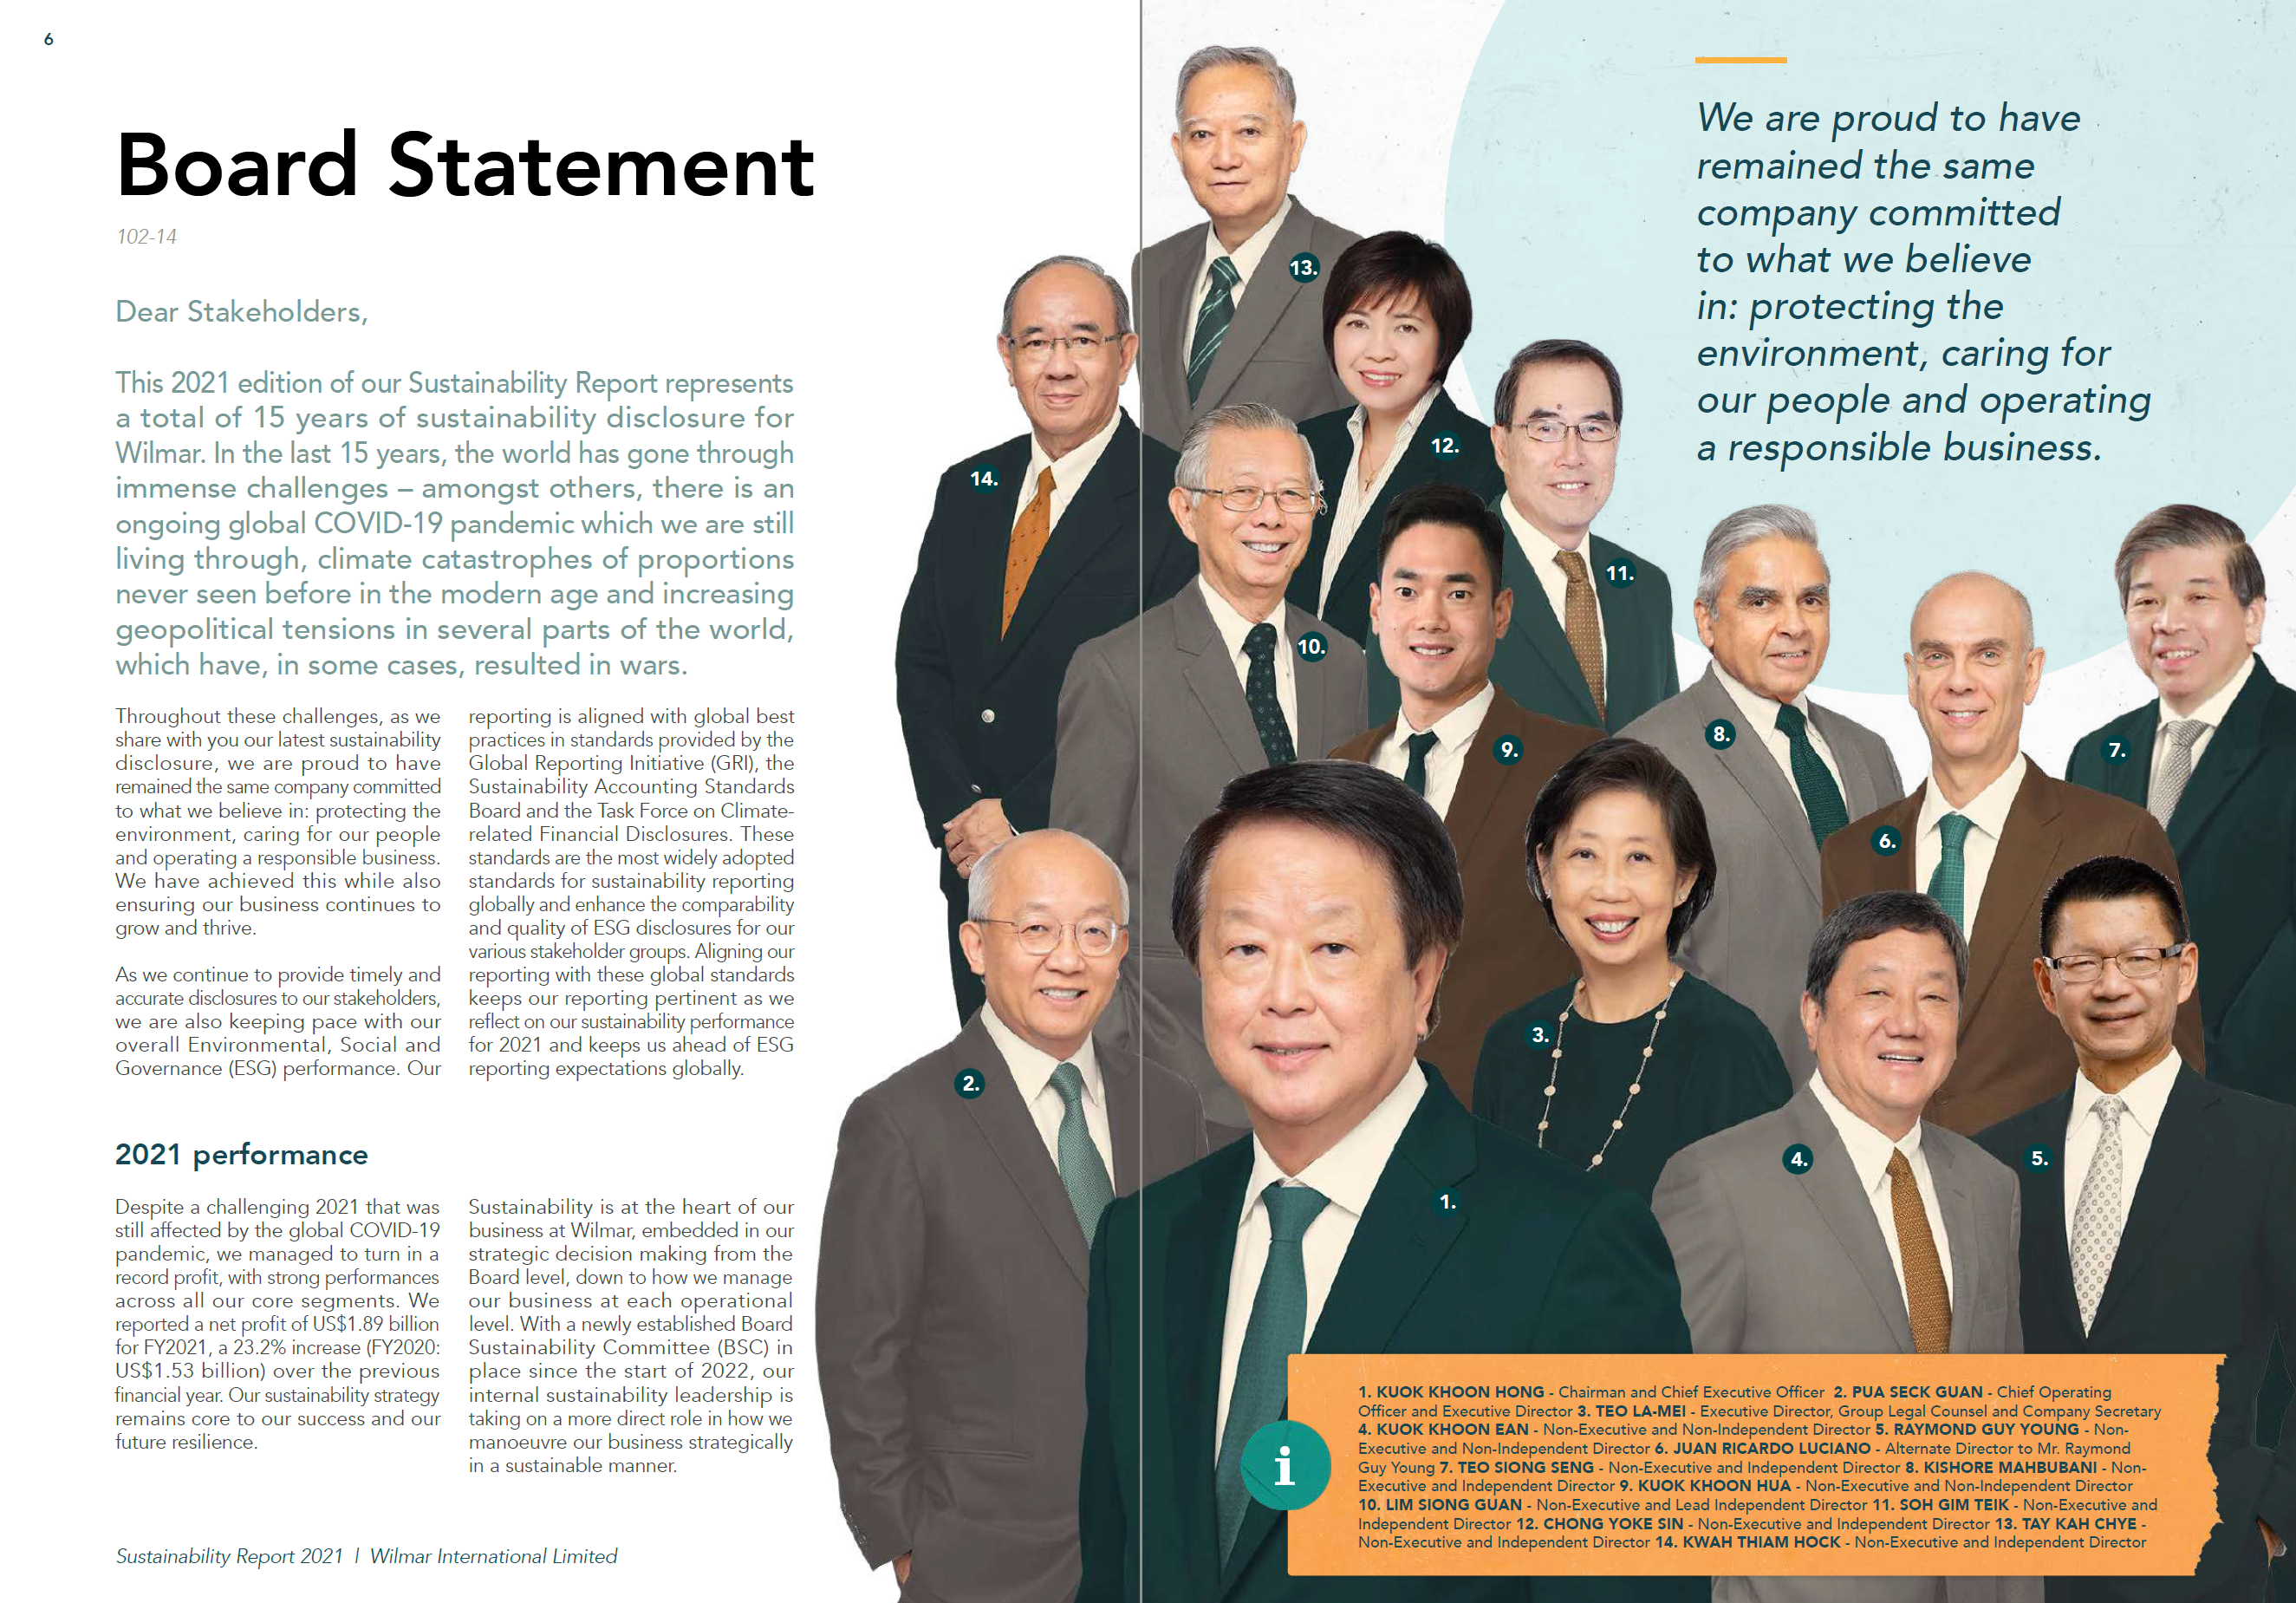
As a graduate of the ESG Competent Boards Certificate Program (Business Professionals cohort, 2021), I am now keenly aware of the role of the Board of Directors in guiding corporate sustainability practice. I have also read Helle Bank Jorgensen's book, Stewards of the Future, that also reinforces the critical role that company directors play in guiding company's to address ESG challenges. Therefore, I look for evidence of the Board's impact and engagement in sustainability practice as I read sustainability reports. Occasionally the Chair of the Board may make opening remarks, in addition to the CEO (or sometimes one letter with two signoffs). Occasionally Board members are quoted. Even more rarely is there a picture of the Board or any additional insight from directors. I think this is an opportunity. Why not bring your Board out of anonymity in your Sustainability Report and let us see how engaged they truly are. Of course they are, right? 

Here's a nice Board Statement in Wilmar's 2021 Sustainability Report.


18. Highlight the Highlights
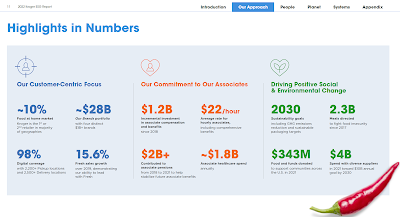
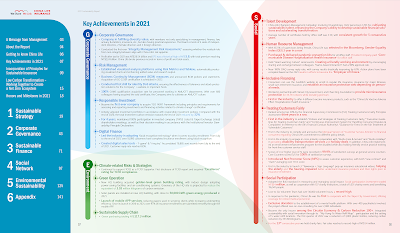
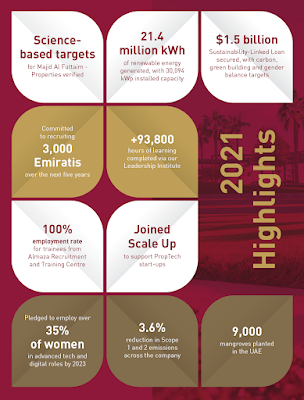
Reports are big chunky things that contain lots of information. Some companies publish Executive Summaries or short report versions for those who want the headlines without all the headaches. But even shorter than that, a highlights page in the early part of your report  is a good way to get a few key messages across for those whose attention span is about 1 minute. It's also a good cheat-sheet for employees to use through the year in their interactions with their different contacts. Highlights pages come in many shapes and formats. Here's a few:


Home Depot 2022 ESG Report

Kroger 2022 ESG Report

China Life Insurance 2021 Sustainability Report


Majid Al Futtaim ESG Report 2021 

19. Check out ReportAdviser
I recently agreed to become an Ambassador for ReportAdviser, a useful reporting hub for professionals that brings sustainability disclosure guidance from multiple reporting standards and frameworks with reporting examples and explanations in one place. With  GRI, SASB, NFRD, TCFD, ISO 26000, S&P's CSA, SDG and sector guidance materials, it's a quick reference guide that can be extremely helpful for reporters needing to check out reporting needs or benchmarking reporting examples without having to trawl through different websites and endless pages of reporting standards. There is also an ESG Data Search that enables you to input any search term and find related reporting examples. I input the term ice cream and got page examples of several sustainability reports mentioning ice cream. YAY! As the sustainability landscape is constantly changing, so ReportAdviser is continuously updating its database and guidance. Worth checking out!

20. Don't Be Late
The average time for publication of a sustainability report from the end of the reporting period is 3.4 months, according to WBCSD's 2022 Reporting Matters, now in its 10th anniversary edition. This is down from a six months average as per the very first Reporting Matters in 2013. In the past few years, report publication date within three months of the reporting period has been steadily increasing.

With GRI 2021 Universal Standards now requiring a publication date to be disclosed in sustainability reports (Disclosure 2-3c), and general pressure to create more alignment between financial and sustainability disclosure timing, a long delay between the end of the reporting period and publication of the sustainability report is becoming rather uncomfortable. Sounds like being at the party is not enough. You have to get there on time.

21. 80% of Something is Better than 100% of Nothing
While some may say it's important to strive for perfection, with about 160+ reporting projects under my belt, I feel justified in saying that perfection is a relative concept in sustainability reporting. It's practically impossible to satisfy everybody's demands and preferences in a single report that must meet multiple needs and disclosure requirements, even with the best of processes. In many cases, reporting managers must navigate demands from different parts of the organization, grapple with disclosures that many may prefer not to include, deal with delays in getting data, approvals, legal signoff, images and design work completed and a host of other challenges. Often there's a trade-off or two or twenty. So while there is no such thing as the perfect sustainability report, what there is is a published report that is the best that can be done under a unique set of circumstances in any company in any given year. It's part of a continuum of annual reporting that should keep improving. That's perfect enough for me. The idea is to embrace feedback / criticism / suggestions for the future and go at it again in the next cycle. 

22: Make Your Report Work for You
You hit publish. The report is out there. Phew! Now it's time for a well deserved rest. But is it? Maybe a day or two. Immediately thereafter, there are three things you should be doing:
  • Thanking all the folks who collaborated and contributed
  • Starting the planning process for the next report
  • Driving the outreach and communications plan to ensure the report actually gets used.
Your sustainability report has a life of several months (assuming timely publication) during which you have an opportunity to use it in a targeted way to continue to build trust and positively influence your company's reputation. Raising awareness goes beyond a single email blast to employees and an external Press Release. Your report amplification plan (which should have been developed well before publication date) is an important part of the reporting process. Use the months post-publication to genuinely engage with employees and onboard them as willing ambassadors of your company's sustainability progress and transparency. Repackage  messaging and stories from the sustainability report to different audiences to drive real conversations about what works and what doesn't. Link up with business schools teaching sustainability and offer to engage with students about your report, answer their questions and respond to their criticisms. There are many ways to benefit from bringing your report to life after publication. After such a significant investment in producing the report, why not get a little mileage? 

23: Surprise
There is no 23. This post is long enough. I am amazed you even got to 23. But it is an opportunity to say Happy New Year! Have a fun and productive reporting season! 

😉


elaine cohen, GCB.D: ESG Competent Boards Certified (2021), Sustainability Strategy and Disclosure Specialist, former HR Professional, Ice Cream Addict. Owner/Manager of Beyond Business Ltd, an inspired Sustainability Strategy and Reporting firm having supported >160 client reports to date; author of three books and several chapters on Sustainability Reporting and the Human Resources connection to CSR; frequent chair and speaker at sustainability events and judge in several sustainability awards programs each year. Contact me via Twitter , LinkedIn or via Beyond Business

Thursday, October 27, 2022

Five Examples of Beauty in Reporting

At a time when everyone is focusing on standards, data and metrics, there’s another side to reporting that often gets overlooked: the graphic design of the report. While the content is the key, the design turns the key to make the content sing🎵. Inspired design makes content more accessible and appealing for those who actually want to read reports, rather than just mine the data. Beautiful reports are inspiring for employees as well attractive for all stakeholders. 

It's clear that some report designs are constrained by in-house branding guidelines that prescribe fonts, colors, shapes and even layouts, so most report designs don't start with a blank page. Even so, there may be some design touches that help liven up the content. The key elements of great report design (in PDF), in my view, include: 
  • Pages that are pleasant to look at – not too empty, not too crowded, with a clear focus for the eye as it rests on the page. The thing that stands out should be the thing that’s most important, not just some random callout factoid. 
  • Consistent design language – I like the design to have its own language throughout the report, creating a familiarity and sense of expectation as you read through it. Disjointed, disconnected imagery and random font sizes and colors drive me a bit crazy. 
  • Clear tables and charts - legible and consistent across the report. Clear headings. NOT ALL CAPITALS. Block capital print is hard to read. 
  • Fonts – rightsized fonts, not too many either. Three different font sizes at most. They should be legible at 100% on my screen. 
  • Format – horizontal PDFs seem to work best for me. The wider sizes offer more room to play with on the page. 
  • Original photos – not image banks with plastic people and Amazon views. Real photos of a real business make the report more credible.  
  • Interesting design elements - little splashes of color or illustrations or (careful) icons, that complement and provide a pleasant eye-tonic alongside the text. 
  • Navigation navigation navigation. I want to sail through the PDF, back and forth, section to section, with single clicks. The navigation needs to be accessible, easy to follow, intuitive, interactive. Navigation tools are useful too. Love a home button that takes you to the contents page. 
  • Ice cream: The more images of ice cream, the better.
Things I hate in report design: 
  • Text that is not horizontal. I have ruined two computer screens when they fell off my desk as I tilted them to read vertical text. Haha.
  • An abundance of meaningless icons 
  • Massive fonts 
  • Photos of palms holding globes 
  • Images representing diversity that are clearly misrepresentative of the organization 
Not all reports that I consider beautiful adopt these design preferences. But they are all beautiful in one way or another because of the colors, visuals, tasteful imagery or other design creatives that bring the narrative to life in an attractive and inspiring way. To me, this shows a level of care and thought in the way the report is presented that helps me believe the intentions of the reporting company. I realize this may not always be a logical correlation, but, in their own way, beautiful reports are inspiring. Here are a few to feast your eyes on (while you are feasting the rest of you on your favorite ice cream):

Roma Group 2021/2022 ESG Report 

Roma Group is a privately-owned small-business valuation and technical advisory services firm in Hong Kong, employing around 60 people. This is the Group’s fifth ESG Report, it’s In Accordance with GRI Core Option and complies with the Hong Kong Stock Exchange ESG reporting rules. At 49 pages, it’s compact, focused and a delight to view. In fact, all Roma Group reports are beautifully designed – take a look at them all.

Roma Group reports have a few signature design approaches for all reports that I like very much. First, the design links to the annual report theme - for example, this year's theme is "The Pursuit of Sustainability". The report creative uses a camping trip to illustrate this theme. This demonstrates that the designer is not just laying out any old content on a page, but thinking creatively about how to reinforce the report messaging. 
 

A second design approach is a creative top menu bar. Although not interactive (a Home button linking back to the contents page would make navigation easier), each report chapter has a unique top menu illustration. A menu is not just a menu - it's an opportunity for creativity. 


A third element is the design of headings. A heading is also an opportunity for creativity. In the examples below, you can see how the paragraph subheadings are embellished with design elements that provide visual interest, especially on text-heavy pages. 


Finally, all tables are clearly presented, using a light touch of color to help differentiate different topics. Roma Group includes a GRI Content Index as well as a Hong Kong Exchange ESG Reporting Index.


I award Roma Group my highest Ice Cream Accolade. Five cones. 🍦🍦🍦🍦🍦.

S Hotels & Resorts Sustainable Development Report 2021

S Hotels & Resorts is a Thailand-based operator with 38 properties in some of the most beautiful locations in the world. No surprise then that the imagery in this report reflects the beauty of the views that visitors can enjoy while consuming their Thai ice creams.

Aside from the spectacular images, the design of this report includes thoughtful ocean-related illustrations on every page and small icon-type illustrations for callouts and highlights. The style complements the narrative and turns each page into a work of art, rather than simply words and paragraphs. Data tables are neatly drawn. Here are a few pages:


Definitely a four-cone design. 🍦🍦🍦🍦

Gucci Equilibrium Impact Report 2021

Gucci is part of the global luxury group Kering that develops and markets fashion, leather goods, jewellery and watches. This second annual Gucci Equilibrium Impact Report references the company's Environmental Profit and Loss accounting, a practice pioneered by Kering several years ago. The Gucci EP&L is not detailed in this report, but Kering's group EP&L is referenced.


The Gucci report combines vivid colors with light-touch design elements throughout the report. Using thread-like elements on each page to liven up images and creative icons for bullets, the report is super attractive in an understated sort of way. A compact navigation top menu on each page helps you get around this 42-page report. In fact, the report is a horizontal wide-page design that fills the screen from end-to-end, where each page actually holds the content of two regular pages, like double spreads. This adds a nice flow to the content and enables continuity on certain pages, such as the timeline page. Oh, and if you are looking for page numbers, don't bother. There are none in this report. Can't decide if that's a good thing or not - certainly one less thing to crowd the page, but perhaps less functional. Don't forget to stock up on luxury ice cream to view this sample of pages from the Gucci report. 


Four cones to Gucci 🍦🍦🍦🍦.

Genesys 2021 Sustainability Report

California-headquartered cloud-based software and artificial intelligence (AI) technology company Genesys has created a beautiful report out of a lot of white space and a focused color palette.  


Using bold colors, brush-stroke design elements and a handwritten-style callout font, it all hangs together in a truly appealing way. Bold images for the section landing pages are captivating, and little touches such as the illustrations on the inclusion timeline chart add visual interest. A full navigation top menu makes navigation super easy. This report is quite masterful in projecting a clean, uncluttered design approach while incorporating a range of content, images, tables, charts and graphs. 


The more I look at the Genesys report, the more I appreciate it's simple appeal. Genesys gets four cones from me, proving that less is more 🍦🍦🍦🍦.
 

Metaxa Hospitality Group Sustainability Report 2021


The Metaxa Group is a Greek-based group operating on the beautiful islands of Crete and Santorini. The Metaxa report projects a Mediterranean calm, inviting you to relax by the deep blue waters of the a hotel pool (don't forget the ice cream) as you peruse its pages.


The beauty in this report is in the flowing lines of the pages, the awe-inspiring imagery of the local landscapes, the colors that remind you of a sandy beach and the careful page composition that, on several pages, includes photos, callouts, data and text. Although sometimes it's quite a lot, it's tastefully put together and maintains a peaceful, calm design feel throughout.  Some images are used as page backgrounds, but care is taken not to render any text illegible. The top menu is not interactive, which is a pity, but it helps you know where you are in the report. 


Four cones also to Metaxa 🍦🍦🍦🍦.


**************


That completes today's roundup of beautiful reports. There are many other fabulous report designs out there - so many different styles and formats - many more that are very impressive. And of course, no matter how beautiful the report, it's the content that we are all looking for.  But, at least, just in case you were wondering, now you know that there is also beauty in reporting. 


elaine cohen, GCB.D: ESG Competent Boards Certified (2021), Sustainability Strategy and Disclosure Specialist, former HR Professional, Ice Cream Addict. Owner/Manager of Beyond Business Ltd, an inspired Sustainability Strategy and Reporting firm having supported >160 client reports to date; author of three books and several chapters on Sustainability Reporting and the Human Resources connection to CSR; frequent chair and speaker at sustainability events and judge in several sustainability awards programs each year. Contact me via Twitter , LinkedIn or via Beyond Business

Related Posts with Thumbnails